
Adaptrade Software Newsletter Article
Building Effective Price Pattern Strategies
Some traders strongly believe that strategies based on price patterns are fundamentally superior to those based on traditional technical indicators. They cite the fact that traditional indicators, such as moving averages and oscillators, typically average values over some number of past price bars, which not only introduces lag but smooths away the very price action that's most important. Price patterns, on the other hand, are based on raw prices, with no smoothing and no lag.
Adaptrade Builder has had price pattern features for many years. In a past newsletter article, I discussed the so-called "price pattern indicator" of Builder and how to use it to develop price pattern strategies. In recent releases of Builder, I've added several new indicators that significantly expand the program's repertoire of price patterns.
This article will demonstrate how to effectively use the price pattern indicators in Builder to develop strategies that avoid traditional indicators and focus solely on price action. The price pattern indicators will be illustrated, and an example strategy will be developed. The project file used for the example, as well as the strategy code, is available below.
A Library of Price Patterns
The different indicators that can be used to create price patterns in Adaptrade Builder are listed below in Table 1. In addition to simple prices, the program considers so-called day prices, the "typical" price, the highest and lowest prices over a specified number of past bars, and support and resistance prices (so-called floor trader pivots). The "price pattern indicator", if selected, specifically instructs the program to consider all selected indicators that return a price value and form logical conditions from them.
Two other indicators that work with raw prices are the consecutive up/down indicators and congestion count. The consecutive up/down indicators can apply to any indicator returning a price, including nested combinations of such indicators, such as AS_ConsecBarsUp(Highest(Lowest(C, 5), 12)). These indicators return the number of consecutive values of the argument in a row that are either up or down, such as the number of bars that close down in a row (i.e., AS_ConsecBarsDn(C)). The congestion count indicator is designed to indicate how "congested" or range-bound the market is. It counts the number of consecutive bars where there is at least one price in common among all bars. The higher the value, the more congested the market is.
Builder uses the price patterns to define logical statements that are used as entry or exit conditions for placing trading orders. For example, a simple price pattern for an entry condition might be C > L[3] (i.e., the current close is greater than the low three bars ago). The condition would have to be true for the entry to be placed. Examples of valid price patterns are shown in Figs. 1 and 2.
In addition to using the price pattern indicators in logical conditions for entry and exit, the indicators that return a price value (simple prices, day prices, Highest(price, N), Lowest(price, N), typical price, and floor trader pivots) can be used to construct a price or price difference for use in stop and limit orders. For example, the following are valid long limit entry prices: AS_PivotS(2); L[2] - 1.2 * AbsValue(TypicalPrice - Lowest(O, 5)); AS_PivotR(1) - 2.9 * AbsValue(AS_PivotR(1) - Highest(H, 12)); etc.
| Indicator | Description | Examples |
|---|---|---|
| Simple prices | Open, high, low, and close. | C; L[5]; H[15]; L |
| Day prices | Open, high, and low of current day; close of prior day. Intraday data only. | OpenD(0); HighD(0); LowD(0); CloseD(1) |
| Highest/lowest | Highest and lowest price over past bars. | Highest(C, 10); Lowest(H, 5) |
| TypicalPrice | (H + L + C)/3. | TypicalPrice < C[1] |
| Floor trader pivots | Three levels of support and three levels of resistance centered around the TypicalPrice. | AS_PivotS(1) > CloseD(1); AS_PivotR(2) < O[3] |
| Price patterns indicator | Combinations of indicators returning price or price difference. | C[5] < Highest(L, 12); TypicalPrice - OpenD(0) > H - L[2] |
| Consecutive bars up/down | Number of consecutive price bars up/down. | AS_ConsecBarsUp(C[5]) < AS_ConsecBarsDn(Highest(L, 12)); AS_ConsecBarsUp(L) > 3 |
| Congestion count | Number of consecutive bars where there is at least one price in common among all bars. | AS_CongestCount = 9; Lowest(AS_CongestCount, 10) > 5 |
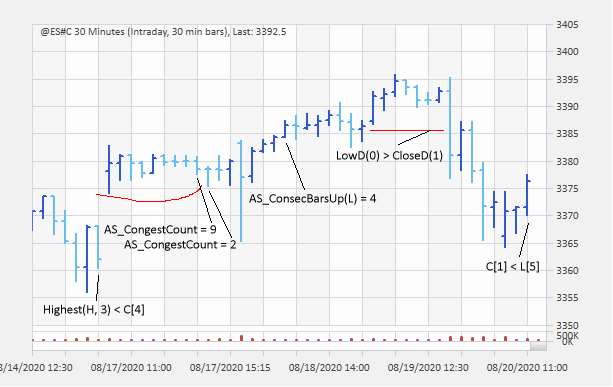
Figure 1. Examples of price patterns.
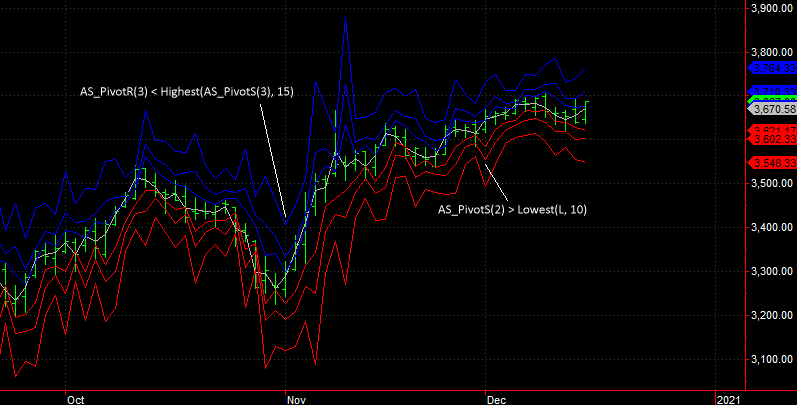
Figure 2. Floor trader support and resistance pivot levels centered around the "typical price". Three levels of resistance above the typical price and three levels of support below the typical price are shown in blue and red, respectively. Two examples of price patterns based on the floor trader pivot levels are indicated.
Settings for Building Price Pattern Strategies
To set up Adaptrade Builder to build price pattern trading strategies, the first step is to select the indicators. After clearing the indicator list by clicking the "Consider None" button (see Fig. 3), the indicators listed in Table 1 can be selected. As shown in Fig. 3, most of the price pattern indicators in Builder are grouped near each in the list. In addition, "Crosses Above/Below" and "Absolute Value" can be selected since both are valid in expressions involving price patterns. Lastly, although not shown in Fig. 3, the true range indicator can be selected for building price pattern strategies. The true range indicator is based on the prices of a single bar and involves no averaging or other smoothing, which makes it a valid component of price patterns.
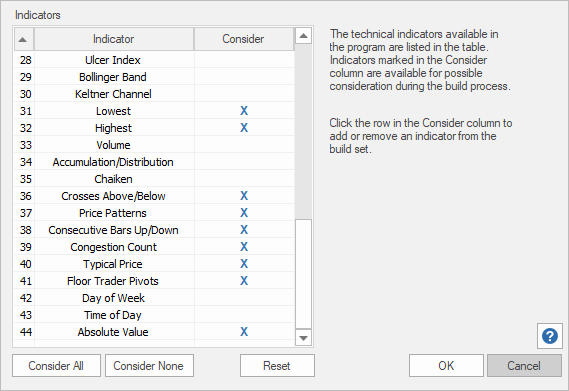
Figure 3. Valid indicators for price pattern strategies in Adaptrade Builder. Also valid for price patterns but not shown: true range.
The next important step is selecting the build metrics. The build metrics define the so-called fitness, which is used to rank the strategies in the population and therefore determines how the population of strategies evolves. The stated goal is to define effective price pattern strategies. A price pattern strategy can be said to be effective if the identified price patterns reliably predict profitable trades. This suggests that we should require a "Pct Wins" (percentage wins) metric with a value greater than 50%.
Pct Wins by itself, however, if probably not sufficient to adequately guide the build process. One approach would be to add several metrics that relate to strategy quality (see, for example, this article on strategy quality metrics ). This would likely result in a wide variety of strategies in the population, which might be preferable if we're not sure exactly what we want, but, for this article, I'd rather select the metrics to more precisely specify the strategies.
Given that we've already decided what we want for the Pct Wins metric, we can consider how this metric relates to other metrics so that we can more intelligently specify those metrics. There's a commonly cited relationship in trading, sometimes referred to as the fundamental equation of trading, that relates the Pct Wins to the win/loss ratio (W/L) and the profit factor (PF). It's easily derived from the definitions of W/L (Ave Win/Ave Loss), Ave Win (gross profit/number of wins), Ave Loss (absolute value of gross loss/number of losses), PF (gross profit/absolute value of gross loss), and Pct Wins (number of wins/(number of wins + number of losses), expressed as a percentage).
The relationship between these metrics can be expressed in either of the following forms:
W/L = PF x [(100 - Pct Wins)/Pct Wins]
or
PF = W/L x [Pct Wins/(100 - Pct Wins)]
Given any two of the three variables in these equations, the third one can be determined. In our case, we already have a value (or range of values) in mind for Pct Wins. If we choose a target value for PF, then we can calculate the W/L value. If the resulting W/L value is not consistent with what we have in mind, then we may want to readjust our Pct Wins and/or PF targets. For example, if we want Pct Wins to be 60% with a PF of 1.7, the first equation tells us that W/L will be 1.13. If this W/L value is not high enough, we would either need a higher PF or a lower Pct Wins.
These equations can also tell us when our selected targets are not likely to be realistic. For example, if we want a W/L of 3 with Pct Wins equal to 60%, the second equation tells us that this corresponds to a PF of 4.5, which is very high and not likely to be found. As above, lowering the W/L ratio would allow for a lower PF.
Notice that even if we know all three of the variables in the equations, the performance results will not be fully specified. For example, the average win and average loss cannot be determined from these metrics without also knowing either the number of wins or the number of losses.
There are several possible ways to use the equations above to help specify the build metrics. One way would be to use ideal trades along with the Ideal Matches metric, as discussed in the prior newsletter article. To do this, the ideal trades could be defined so that the minimum profit and maximum MAE correspond to the W/L ratio calculated from the first equation. For example, using the numbers given above — a PF of 1.7 and a Pct Wins of 60% — we would set the minimum win and maximum MAE so that the ratio was about 1.1. If we combined this with setting a condition for either the PF or Pct Wins, this would not only specify the three metrics in the equations but would also effectively set targets for the average win and average loss, fully specifying the results we want.
Another approach, which I'll adopt for this article, is to specify two of the three metrics in the equations, implying a value for the third metric, and supplement these with a general build objective and several metrics for overall strategy quality. The set of metrics shown below was used in the example that follows.
Maximize Net Profit, weight 1.000
Minimize Complexity, weight 0.100
Pct Wins between 60% and 65%
Win/Loss Ratio between 0.800 and 1.100
Max MAE ≤ $4,500.00
Corr Coeff ≥ 0.9800
Trade Sig ≥ 98.00%
Maximizing net profit is almost always a suitable build objective, and adding Complexity as an objective with a small weight tends to bias the population towards somewhat simpler strategies, which helps avoid over-fitting. Notice that I chose a range for both the Pct Wins and W/L metrics. Using a range, rather than an inequality, such as Pct Wins >= 60%, can help keep the population metrics aligned with each other. For example, if the Pct Wins were to get too high, for a given profit factor, it would imply (by the first equation) a W/L value below what we have in mind. Based on a preliminary build, I also added a condition for the Max MAE. The conditions for Corr Coeff and Trade Sig are general strategy quality metrics, which are suitable for nearly any strategy.
I built the strategies over 30-minute bars of the E-mini S&P 500 futures (symbol @ES#C from IQFeed), day session (9:30 am to 3:15 pm), from 09/03/2012 to 08/21/2020. Costs were assumed to be $10 per round turn, and a fixed size of one contract per trade was used. The population size was 500 with 50 generations (no rebuilds or termination rules). Other settings were left at the defaults.
The data were divided into training, test, and validation segments. The build process is based only on the training segment. To test for over-fitting, the strategies were sorted by the fitness calculated on the test segment. The strategy with the highest fitness on the test segment was then selected, and the results on the validation segment were examined. Good results on the validation segment imply that the strategy's performance generalizes well to new data. I previously discussed this three-segment approach and explained how it compensates for both training bias and selection bias.
All settings described above are available in this project file, which can be opened in Adaptrade Builder version 3.2.0. The program is available as a free trial via the Builder download page for those who want to examine the project file but don't have a licensed copy of the program. The EasyLanguage code in text file format for the selected strategy is available here.
Results
The equity curve for the strategy developed using the process described above is shown below in Fig. 4. The positive results on the validation segment suggest the strategy generalizes well to new data.
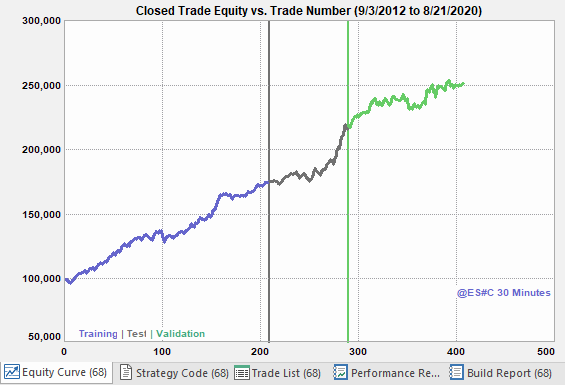
Figure 4. Equity curve for the selected strategy evaluated on the E-mini S&P 500 (ES).
Key performance statistics for the strategy depicted in Fig. 4 are given below, as calculated over the entire price history (training, test, and validation combined). Note that most of the metrics meet or exceed the build requirements, except for the Max MAE.
Net Profit: $151,705
Number of Trades: 407
Pct Wins: 60.0%
Prof Fact: 1.86
Win/Loss Ratio: 1.24
Max MAE: $13,925
Corr Coeff: 0.981
Trade Sig: 100.0%
Ave Trade: $373
Max Drawdown: $24,735
The elements of the strategy logic that utilize price pattern indicators are shown below. The long entry limit price is based on the floor trader pivot resistance and the true range. The long entry condition uses day prices (OpenD, CloseD), and the short entry condition is based on the TypicalPrice indicator.
                                { Entry prices }
                                EntPrL = AS_PivotR(LevEntL1) - EntFrL * TrueRange;
                                EntPrS = C + EntrySzS/BigPointValue;

                                { Entry and exit conditions }
                                VarL1 = OpenD(0);
                                VarL2 = CloseD(1);
                                VarS1 = HighD(0);
                                VarS2 = TypicalPrice;
                                EntCondL = VarL1 >= VarL2;
                                EntCondS = VarS1 > VarS2;
Summary and Discussion
Price pattern-based trading strategies can be attractive in that they avoid indicators that have inherent lag and that smooth over potentially tradable price action. Adaptrade Builder has several price pattern indicators, including ones based on calculated prices (typical price, floor trader pivots) and ones calculated from prices (consecutive prices up/down, congestion count). The build algorithm in Builder can combine the different price pattern indicators in myriad ways for use as logical conditions for trade entry and exit. In addition, the price-based indicators, such as day prices and floor trader pivots, can be used to form entry and exit prices for stop and limit orders.
To use these indicators to build effective price pattern strategies, I discussed how to select build metrics by considering the relationship between three common metrics (profit factor, percent wins, and win/loss ratio). While the equations relating these metrics were presented in the context of the current article, the equations themselves apply to all trading strategies and can be used to help guide the selection of metrics for any build project. I gave an example of a set of build metrics suitable for 30-minute bars of the E-mini S&P 500 futures and ran a build with those metrics using only price pattern indicators.
To ensure that the training and selection biases did not undermine the build process, I explained how to sort the strategies and select one based on the test fitness and verify the results using the validation segment. The strategy selected according to this method showed good results on all three data segments.
For those who prefer trading strategies based on price patterns rather than traditional technical indicators, this article presented a simple build approach that combines a method of metric selection with a method for strategy selection. The methods were chosen to generate realistic and positive results while minimizing the risk of over-fitting, goals that were achieved in the build example. Please feel free to use this article as a starting point for your own efforts to develop price pattern strategies for your favorite markets.
Good luck with your trading.
Mike Bryant
Adaptrade Software
This article appeared in the December 2020 issue of the Adaptrade Software newsletter.
HYPOTHETICAL OR SIMULATED PERFORMANCE RESULTS HAVE CERTAIN INHERENT LIMITATIONS. UNLIKE AN ACTUAL PERFORMANCE RECORD, SIMULATED RESULTS DO NOT REPRESENT ACTUAL TRADING. ALSO, SINCE THE TRADES HAVE NOT ACTUALLY BEEN EXECUTED, THE RESULTS MAY HAVE UNDER- OR OVER-COMPENSATED FOR THE IMPACT, IF ANY, OF CERTAIN MARKET FACTORS, SUCH AS LACK OF LIQUIDITY. SIMULATED TRADING PROGRAMS IN GENERAL ARE ALSO SUBJECT TO THE FACT THAT THEY ARE DESIGNED WITH THE BENEFIT OF HINDSIGHT. NO REPRESENTATION IS BEING MADE THAT ANY ACCOUNT WILL OR IS LIKELY TO ACHIEVE PROFITS OR LOSSES SIMILAR TO THOSE SHOWN.