
Adaptrade Software Newsletter Article
Ideal Trade Matches as a Metric for Strategy Building
Trading strategy generators, such as Adaptrade Builder, are designed to simplify and improve the strategy development process by replacing the need to specify every element of the strategy's logic and design with a higher level description based on performance requirements, such as the maximum allowable drawdown, required profit factor, and other metrics. The generator's build process then creates strategies that meet the specified requirements.
In most cases, this process works well. However, coming up with a suitable set of build metrics is not always easy. If the metric values are not market-specific enough — if they don't correspond to trades that the market is capable of producing — it won't be possible to find strategies that satisfy the specifications. For example, consider the following set of requirements: average trade of at least $300, at least 75% winners, and a maximum loss of no more than $500. If the average true range for the market and bar size is too large, it might not be possible to find strategies that generate those types of results. On the other hand, selecting a set of broad, nonspecific metrics may not result in the kind of strategies you have in mind. For example, if you were to generate strategies that maximize the net profit, with no other requirements, the resulting strategies might have a small number of trades, where each trade was a long-term buy-and-hold. If your intention was to find strategies that trade frequently, this kind of nonspecific build metric might not work very well.
As I discussed in a prior article (see Methods for Metric-Based Strategy Building), the usual method for finding a suitable compromise between requirements that are not market-specific enough and those that are too broad is to use a trial-and-error approach over repeated builds. While this usually works, it's often time-consuming, and it can be difficult to know which metrics to focus on. It would be more convenient to be able to tell the software to find strategies that produce trades that fit the price action of the market you're trading. In many cases, it's easy enough to identify the kinds of trades you would want a strategy to produce based on the price chart; you can see where you would want to enter and exit trades based on the price bars. The question is how to specify this kind of information as an input to the build process.
What are Ideal Trades and How Can They Be Used?
Ideal trades are ones that can be identified in hindsight and are always "profitable"; the entries and exits are chosen specifically to produce a desired trade result. Ideal trades can be used to estimate the potential profit in the market, such as with Pardo's "perfect profit"1, which I wrote about in a prior article, or they can be used as targets for strategy building.
In another article on this topic, I described ideal trades that entered at the open and exited at the close on intraday data. In that article, the idea was to use the ideal trades to generate metric values for the average win, number of wins, and average bars in wins. The build process was then focused on matching those metrics. There were several problems with that approach. First, the definition of ideal trades used in that article was very limited. Secondly, the process of using the ideal trades required several steps, including running a separate program to compile the trades and processing them to generate the metrics. Lastly, matching metrics is not the same as matching trades. Even when strategies are found that match (or come close to) a set of metrics, it doesn't mean the strategies are matching the ideal trades from which those metrics were derived; it's possible the same or similar metric values could result from a different set of trades.
This article takes a different approach. The ideal trades described below are more versatile than in the prior article and are generated automatically in Adaptrade Builder. More importantly, the trades generated by each strategy are compared to the ideal trades to compute a match metric for measuring the correspondence between the two sets of trades. By building strategies that maximize the match metric, the generated strategies reproduce as many of the ideal trades as possible. This simplifies the specification of build metrics while basing the build process on market-specific characteristics.
Defining Ideal Trades for Matching
While there may be a number of different ways to define so-called ideal trades, the intent here is to define trades that would desirable to duplicate in real trading. Accordingly, the ideal trades are based on a specified maximum risk and a minimum profit. The risk is defined as the largest open loss prior to the exit, which is also known as the maximum adverse excursion (MAE). While both risks and profits could be defined adaptively, such as in terms of multiples of the average true range or as a percentage of price, to keep things simple for the purposes of this article, fixed dollar amounts were used. Trades are assumed to be entered and exited at the bar's open. Only long ideal trades are considered here, although it would be simple enough to look for short trades in the same way.
The key to using ideal trades for matching is to define the trades so that they have a range of bars for both entry and exit. If they were defined with only a single entry bar and a single exit bar, the likelihood of getting matches would be substantially lower and the utility of the matching metric would be questionable.
The process of identifying the ideal trades proceeds as follows:
- Calculate the risk/MAE at bar i. If the MAE is below the specified risk limit, proceed to the next step.
- Calculate both the profit and risk/MAE on bar j = i + 1. If the profit is less than the minimum and the MAE is less than the maximum, increment j and repeat this step. If the profit is greater than or equal to the minimum and the MAE is less than the maximum, a valid ideal trade has been found, so go to the next step. If the MAE is exceeded before the minimum profit is reached, a valid ideal trade does not exist at bar i, so increment i and return to step 1.
- Try to extend the range of exit bars for the ideal trade found in the prior step. Increment j and calculate the MAE. As long as the MAE is not exceeded, add bar j to the range of exit bars for the ideal trade. If the MAE is exceeded, go to the next step.
- Try to extend the range of entries for the ideal trade found above. At bar k = i - 1, repeat the steps above. If a valid ideal trade is found at bar k, add this bar to the original trade's entry bar range and add the exit bars to the original trade's exit bar range provided the exit bar ranges overlap. Decrement k and repeat until a valid ideal trade cannot be found or the exit bar ranges no longer overlap. Set k = i + 1 and repeat this step, incrementing k instead of decrementing it at each step.
- Set i to the bar following the end of the entry bar range for the current ideal trade and go back to step 1.
By following this process, a set of ideal trades is generated that includes a range of bars for both entry and exit. For each bar in the entry bar range, there is at least one bar in the exit bar range that satisfies both the risk and profit requirements, although there may be many such exit bars. In addition, there may be exit bars where the profit requirement is met that are separated by exit bars that don't meet the profit requirement, provided those bars don't exceed the MAE. This allows the ideal trade to match a strategy-generated trade where the exit occurs later than at the first opportunity, as long as the MAE is not exceeded. Also, by searching for the next ideal trade on the bar following the last bar in the entry bar range for the current ideal trade, every bar is examined as a possible entry bar for an ideal trade. This implies that if a strategy-generated trade meets the profit and risk requirements, there is an ideal trade that matches it.
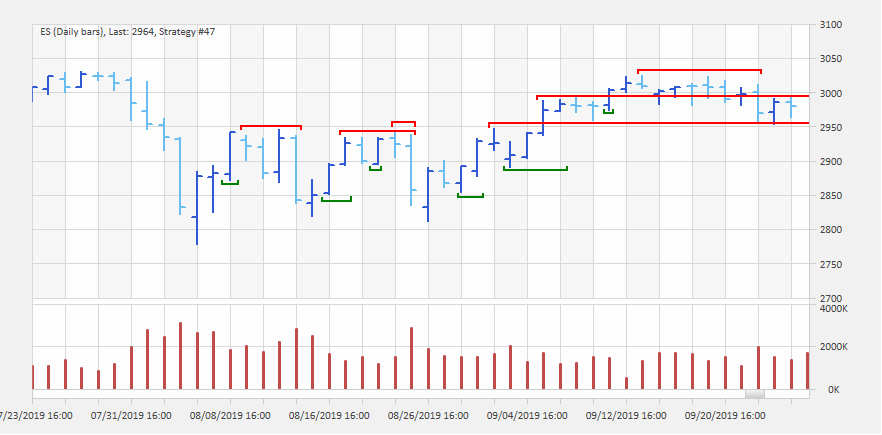
Figure 1. Ideal trades on daily bars of the E-mini S&P 500 futures. Ideal trades were defined as a minimum profit of $1500 with a maximum risk of $750. Green bars with up-pointing tabs represent the entry bar ranges, while red bars with down-pointing tabs represent the exit bar ranges.
Examples of ideal trades are shown in Fig. 1 for daily bars of the E-mini S&P 500 futures. Notice that for two of the trades, the exit ranges extend off the end of the chart due to the sustained up trend. Also notice that whereas entry ranges never overlap, an entry range can overlap with the exit range of one or more other ideal trades, and different exit ranges can overlap. These characteristics enable maximum flexibility in matching the ideal trades to strategy-generated trades.
The Matching Process
Once the ideal trades have been identified, the matching process is straight-forward. A strategy trade matches an ideal trade if the profit of the strategy trade is at least as great as the specified minimum profit of the ideal trade (e.g., $1500 in Fig. 1), the MAE of the strategy trade is no greater than the maximum MAE of the ideal trade (e.g., $750 in Fig. 1), the entry bar of the strategy trade lies within the range of entry bars for the ideal trade, and the exit bar of the strategy trade lies within the range of exit bars for the ideal trade. Examples of hypothetical strategy trades matching the ideal trades of Fig. 1 are shown in Fig. 2.
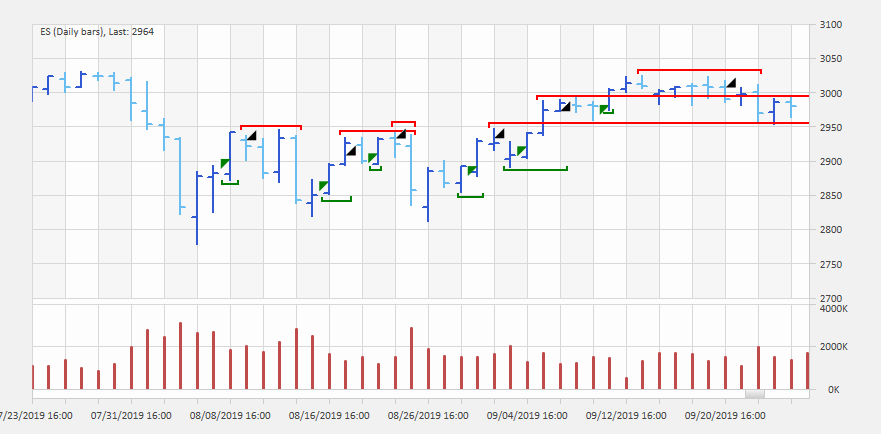
Figure 2. Ideal trade matches on daily bars of the E-mini S&P 500 futures. Hypothetical long strategy trades matching the ideal trades shown in Fig. 1 are depicted. Green triangles, where the right-angle of the triangle is in the upper left corner, represent trade entries, and black triangles, where the right-angle of the triangle is in the lower right corner, represent trade exits.
To define the "Ideal Matches" metric, the number of matches is combined with the number of strategy trades that don't match an ideal trade. To understand why both matches and non-matches are important, consider two examples. In the first, suppose there are 500 ideal trades and only 10 strategy trades. If all 10 strategy trades match an ideal trade, considering only the strategy matches would imply 100% perfect matching, whereas only 2% of the 500 ideal trades have been matched. In the second example, suppose there are 100 ideal trades but 1000 strategy trades. If all 100 ideal trades are matched by a strategy trade, considering only the ideal trade matches would give the impression of perfect matching, whereas only 10% of the 1000 strategy trades have been matched. Perfect matching can be defined as having the number of matches equal to the number of ideal trades with no non-matching strategy trades. To represent this, I settled on the following definition for the "Ideal Matches" metric:
Ideal Matches = 100 * NM/[NI * (a * NN^2 + 1)]
where NM is the number of matches, NI is the number of ideal trades, NN is the number of non-matching strategy trades, "a" is a constant, and "^" represents exponentiation (i.e., NN is squared). This equation generates a metric that lies within the range 0 (no matches) to 100 (all ideal and strategy trades match). The term (a * NN^2 + 1) is designed to keep the denominator relatively small for small values so that a small number of non-matching trades doesn't penalize the metric too much. For example, with a = 0.0001 and NN = 100, (a * NN^2 + 1) has the value 2. If, on the other hand, I had used the simpler term (NN + 1), 100 non-matching trades would result in division by 101. Also, the exponent means that for increasing values of NN, the penalty is progressively larger, so a large number of non-matching trades results in a very small Ideal Matches value.
Ideal trades and the Ideal Matches metric will be available as new features in version 3.2 of Adaptrade Builder. Please visit the web site for information on the most recent releases, including release notes.
Building with Ideal Matches
I tested several different ways to use the Ideal Matches metric for building strategies in Adaptrade Builder.
Ideal Matches as the Sole Metric. To see how effective the Ideal Matches metric could be by itself, I set a single build objective to be the Ideal Matches metric. There were no build conditions. As expected, this tended to generate strategies that had a similar number of trades to the number of ideal trades. For example, building over daily bars of the E-mini S&P 500 futures from 9/4/2012 to 3/6/2020, there were 207 ideal trades in total using the same settings as in Fig. 1. This corresponded to 115, 37, and 55 ideal trades on the training, test, and validation segments, respectively. After a typical build over 100 generations, the number of strategy trades in the top strategy was 90, 29, and 49, respectively, over the three segments, or 168 trades over the entire date range. The Ideal Matches metric on the training segment of the top five strategies ranged over several different builds from the high single digits to about 25%.
Notably, the number of trades in strategies generated using this approach was relatively uniform within the population and between populations from different builds. This was not the case when building on the same data with the less market-specific objective of maximizing net profit. In that case, it was common to see some top strategies with only a handful of trades in the training segment while others had almost a thousand.
Interestingly, the best strategies (subjectively) were not the ones with the highest value of the Ideal Matches metric. This may be because the ideal trades chosen to illustrate the concept are fixed in size, rather than being adaptive to the market's volatility. As a result, there may be other trades that don't fit the definition of "ideal trade" that work better in some cases. Forcing the strategies to match more ideal trades may prevent it from generating other, more favorable trades.
Ideal Matches with Build Conditions. To try to improve upon using the Ideal Matches metric by itself, I added several build conditions. In particular, I added conditions for the profit factor, percentage of wins, trade significance (i.e., statistical significance of the average trade), and correlation coefficient of the equity curve. Overall, this tended to yield better results with more of the performance metrics in a desirable range, as intended by the build conditions. At the same time, the Ideal Matches metric values did not seem to decline for the top strategies, and the number of trades and average trade size still appeared to be controlled by the goal of matching the ideal trades.
Ideal Matches with Build Conditions and Maximizing Net Profit. Given that the Ideal Matches metric had a value less than about 25% in most builds, the majority of trades were not ideal trades. This was true even for the profitable trades. For that reason, I decided to add Net Profit as a build objective (along with Ideal Matches) in order to more directly influence the trades that were not matching an ideal trade. I found that setting the relative weight of the Ideal Matches metric to about 0.2 or 0.3 of the weight for Net Profit still allowed the Ideal Matches metric to influence the results while producing better results overall.
I repeated the tests summarized above on a longer series of data (9/4/2007 to 8/21/2020) for the same market. While
the Ideal Matches metric values were lower (e.g., high single digits), possibly due to the fact that the longer series
had more down trends and the strategies were long-only, the observations noted above were also valid on this
longer data series.
Discussion
In strategy generating software, one of the first steps in setting up a new build is to specify the metrics that will guide the build algorithm. However, many metrics require market-specific values, which can make finding them challenging and time-consuming, particularly if you haven't traded the market before. The purpose of this article was to present a method for simplifying this process. Rather than using a trial-and-error approach to find suitable values for market-specific metrics, this article explained how to define a set of ideal trades in conjunction with the "Ideal Matches" metric.
The primary effect and benefit of using the Ideal Matches metric is that it provides a way to specify market-specific build conditions related to trade metrics, such as the average trade size, number of trades, average bars in trades, and so on, without having to determine appropriate values for the individual metrics. By specifying just two values, such as the minimum profit and maximum risk, which can be verified visually on the price chart, the resulting ideal trades provide targets for strategy building. Even though only a fraction of the ideal trades may be matched by any strategy, the goal of matching them guides the build process to strategies with metric values that generally reflect the ideal trades.
Compared to other methods that use ideal trades in strategy building, such as using the equity curve or the metrics that correspond to the ideal trades, the method described above is more direct in that it's based on matching the trades themselves. This may help explain why it seems to steer the population of strategies towards ones with metrics representative of the ideal trades despite the low match percentages.
Based on the testing described above, the best way to use the Ideal Matches metric may be to combine it with a nonspecific build objective, such as maximizing net profit, and several general build requirements, such as ones based on profit factor, percentage of winning trades, trade significance, correlation coefficient, etc. Conditions or requirements based on these types of metrics are relatively easy to define compared to metrics that are more market-specific, such as the average trade size, number of winners, and so on. For example, if a trader likes to see a profit factor of at least 1.7 or at least 60% winners, these can be used as conditions. I previously discussed nonspecific metrics in the article Strategy Quality Metrics Improve Out-of-Sample Results.
The methods described above were simplified for the purposes of this article. In the forthcoming release of Adaptrade Builder, it will be possible to generate both long and short ideal trades. In addition, the ability to specify the risk and minimum profit for the ideal trades in terms of multiples of the average true range will be available. These improvements should help make the ideal trades feature and the Ideal Matches metric even more useful in the automated strategy generating process.
References
- Pardo, R. Design, Testing, and Optimization of Trading Systems, John Wiley & Sons, Inc., New York, 1992.
Good luck with your trading.
Mike Bryant
Adaptrade Software
This article appeared in the September 2020 issue of the Adaptrade Software newsletter.
HYPOTHETICAL OR SIMULATED PERFORMANCE RESULTS HAVE CERTAIN INHERENT LIMITATIONS. UNLIKE AN ACTUAL PERFORMANCE RECORD, SIMULATED RESULTS DO NOT REPRESENT ACTUAL TRADING. ALSO, SINCE THE TRADES HAVE NOT ACTUALLY BEEN EXECUTED, THE RESULTS MAY HAVE UNDER- OR OVER-COMPENSATED FOR THE IMPACT, IF ANY, OF CERTAIN MARKET FACTORS, SUCH AS LACK OF LIQUIDITY. SIMULATED TRADING PROGRAMS IN GENERAL ARE ALSO SUBJECT TO THE FACT THAT THEY ARE DESIGNED WITH THE BENEFIT OF HINDSIGHT. NO REPRESENTATION IS BEING MADE THAT ANY ACCOUNT WILL OR IS LIKELY TO ACHIEVE PROFITS OR LOSSES SIMILAR TO THOSE SHOWN.