
Adaptrade Software Newsletter Article
How to Build Effective Breakout Strategies
Breakout trading strategies are one of the most popular and effective types of strategies for many different markets. I thought enough of them to name my first trading business — Breakout Futures — after them. By their nature, breakout strategies are trend-following. They buy or sell when the market breaks above or below a specified price level under the assumption that the market will keep moving in the direction of the breakout. The price levels can be thought of as channels, so these types of strategies are also referred to as channel breakout strategies.
This article discusses the main issues involved in building breakout strategies and demonstrates how to build reliable and robust breakout strategies in Adaptrade Builder, a trading strategy generator. Several different types of breakout strategies are shown, and the strategy code is provided below for each one.
Elements of the Breakout Strategy
All trading strategies should include the following basic elements: (1) entry rules or conditions, (2) rules or conditions for exiting at a profit, and (3) rules or conditions for exiting at a loss. Position sizing and other risk management methods can also be considered, but since these methods are not usually part of the strategy's trading logic and can generally be added after the strategy is developed, I prefer to consider them separately from the strategy itself.
The basic idea behind breakout strategies is to enter the market long or short, respectively, when it rises above or below (breaks out from) a specified price level. While this could be done using market orders, doing so would generally introduce a delay or lag between the time the market rises above or below the price level and the time the market order is placed. To avoid that, stop orders are generally used, where the stop price is the price level of the channel. Once in the trade, exit orders can be placed to exit at a profit, exit at a loss, or reverse the trade (long to short or short to long).
Entering the Trade
Classic price levels for entering a breakout trade include Bollinger bands and Keltner channels, moving averages, channels formed from the average true range (ATR), such as "enter long at C + 2 * ATR(10) stop", and highest highs and lowest lows (e.g., "enter short at Lowest(L, 14) stop"). However, any price above the market for a long trade or below the market for a short trade is a potential price channel for a breakout strategy. For example, "enter long at H + 2 points stop" would form a channel two points above the high of each bar. Builder is also capable of more complex constructions, such as "Highest(H, 25) + 1.7 * Abs(Average(C, 14) - Average(L, 3))". Some of these different price channels will be shown below in the strategy code examples.
Trade entries can use symmetrical price channels or channels with different boundaries for long and short trades. It's tempting to make all channels symmetrical, such as entering long at Highest(H, 20) and short at Lowest(L, 20). Another example of a symmetrical channel would be entering long at Average(C, 10) + 10 points and short at Average(C, 10) - 10 points. Bollinger bands and pivot support and resistance levels are other examples of symmetrical price channels. However, in many markets, such as stock indexes, the long and short sides have inherent asymmetries. In this case, it might make sense to choose different price levels for the long and short channel boundaries. The primary advantage of symmetrical entry conditions is that they're simpler, which means the strategy may have fewer parameters and may be less over-fit to the market as a result.
One question with trade entries is whether or not to combine the channel breakout with additional logical conditions. For example, the strategy might include a moving average crossover condition that must be met in order to place the stop order for entry, so that the channel breakout will only trigger an entry if the moving averages cross over on the prior bar. Breakout strategies can work either way. Sometimes, the price channel provides a sufficiently strict condition for entry so that no other restrictions are necessary. In other cases, adding additional conditions can help prevent so-called false breakouts (see below for more on this). However, adding restrictions reduces the number of trades, and not all trades that the additional conditions filter out will be losses (since no condition is perfect). Deciding whether the additional condition is worth it often involves balancing different performance metrics, such as net profit, percent profitable, profit factor, and so on.
Exiting the Trade
Strictly speaking, breakout strategies are defined by their entries. Once in the trade, any standard exit technique can be used. In Builder, exit types include protective stops, target exits (exiting on a limit order), trailing stops, exiting after some number of bars, including exiting after some number of bars with the additional condition of either a profit or a loss, exiting after a certain time of day, exiting at the end of the trading session (for intraday data), and exiting at the end of the week. The protective stops exit at a loss. The profit target and trailing stops exit at a profit. The bar and time-based exits can exit at either a profit or a loss.
The aforementioned exits are all designed to go flat from either a long or short position. In this case, the next entry is only allowed after the prior position has exited. The other option is to reverse the position, going from long to short or from short to long. This is based on the idea that when the entry conditions for a trade in the opposite direction occur, the current trade should be reversed, rather than waiting for it to exit according to its own exit rules. However, this also means that the exit conditions for each trade are the same as the entry conditions for the trade in the opposite direction. It's not often the case that the best exit conditions for a trade are the same as the entry conditions for a trade in the opposite direction. In general, exit conditions are probably best set separately from trade entries for the opposite side of the market. One advantage of so-called stop-and-reverse trading logic is that it simplifies the strategy, and, as noted above, simpler strategies — all other things being equal — are generally more robust. The other advantage is that you're always in the market, so you never miss a big move, although you could be on the wrong side of it.
Avoiding False Breakouts
One of the biggest concerns with breakout strategies is so-called false breakouts. This refers to situations where the market fails to follow through on the breakout. In other words, the trend fails to materialize following the breakout, resulting in a loss. This is where a tool like Adaptrade Builder is most useful. By evolving a population of breakout strategies based on specified performance metrics, the build algorithm can identify entry and exit logic that minimizes false breakouts. This may mean restricting the breakout entry using an additional logical condition, as noted above, or it may mean different exit orders, such as a target exit that takes a profit before the market reverses or an exit after N bars if the trade is a loss. The build algorithm is designed to find these strategy elements automatically.
Ultimately, when using a strategy generating tool such as Builder, the key to avoiding false breakouts is to recognize what they look like in the performance report. Specifically, a breakout strategy with too many false breakouts will tend to have a low percentage of winning trades, a large maximum loss, and, typically, a large maximum MAE (maximum adverse excursion). If those metrics and/or related ones have poor values, they can be targeted by adding build conditions that set reasonable limits on those metrics.
Data Considerations
When selecting the data to use when building a trading strategy, the two most important questions are how much and how to divide it between training, test, and, optionally, validation. The question of how much involves several considerations. First, to minimize the risk of over-fitting the strategy to the data, it's the number of trades that matters more than the number of bars of data. As a rule of thumb, consider requiring at least several hundred trades in the training segment.
The other consideration for how much data to use is how many different market conditions it covers. For example, if you use data from a bull market, and the market turns bearish, your strategies could quickly fail. This is why strategies built over short time frames on small bar sizes, such as 1-minute or 5-minute bars, generally need to be rebuilt frequently. Several hundred thousand 3-minute bars may give you strategies with more than 1000 trades per strategy, which seems like more than enough trades for reliable results. However, those 250000 bars may only represent two years during which the market went mostly in one direction. As soon as the market changes its character, the strategies could stop working.
In Builder, there are both "test" and "validation" segments in addition to the training segment. Only the data from the training segment is used in building the strategies. The test segment is only used with the "build failure" and "build termination" rules, which are optional. If those rules are not used, both the test and validation segments are out-of-sample. In that case, which applies to the examples shown below, the test segment can be used for out-of-sample testing, and the validation segment can be set to zero.
Deciding how to divide the data between the training and test segments involves considerations similar to those for deciding how much data to use for training. The most important consideration is to avoid dividing the data at a change in market character, such as at the end of 2021, shortly before the market went from bullish to bearish. Ideally, both sides of the division should include the same kinds of market conditions. If you find that all your results fail in the out-of-sample period with no other apparent explanation, it's most likely due to a change in market conditions. Another consideration for setting the division between segments is that you want to have enough trades in the out-of-sample segment (test and/or validation segments) for reliable results. This suggests there should be at least 30 trades in the out-of-sample segment(s).
Above, I discussed how the data should include a variety of market conditions. One way to achieve this is to build over multiple symbols. In some cases, this is an easy decision, such as building a strategy over a portfolio of stock symbols so that the strategies will work well on all symbols. However, in the case of futures symbols, it's more common to restrict strategies to one symbol or a small number of similar symbols, such as the E-mini S&P 500 and the E-mini NASDAQ 100 futures.
When building over single symbols, there are several ways to increase the variety of conditions in the data. One way, which Builder implements as a Monte Carlo robustness feature, is to randomly vary the price data to create related, but slightly different data series. Building over all these series simultaneously reduces the chance that the strategies will become over-fit to specific features of the data. Another approach is to create synthetic price data from the symbol and build over multiple sythetic data series in addition to the original series. This is basically a stricter version of the Monte Carlo robustness test in Builder. For a more detailed explanation of the synthetic data approach, see the article by Dr. Jonathan Kinlay.
Evaluating Strategies
The evolutionary build process in Adaptrade Builder ranks strategies based on the performance metrics selected by the user. The highest ranking strategies are the ones with the highest so-called fitness, which is a combination of the selected performance metrics. However, after the build process has finished, evaluating a strategy involves more than just selecting the one with the highest fitness. Why is this? For one thing, fitness is a relative measure; it only measures the performance of the strategy relative to others in the population. To decide whether a strategy is good enough to trade may require other considerations, such as whether the strategy has exceeded a performance benchmark, if it has any outlier trades that are distorting its performance, the effect of variable position sizing on the results, whether it would fit into an existing portfolio of strategies, etc. Secondly, the build process can't take every metric into account or it would be unfocused and ineffective. If, for example, your metrics focus the build on net profit, trade size, and profit factor, you should still consider other metrics when evaluating the strategies, such as drawdown, MAE, percentage of wins, etc.
Examples of Breakout Strategies
To illustrate some of the points discussed above, five populations of breakout strategies were built using Adaptrade Builder. All strategies were built on the same data: approximately 22 years of daily bars of E-mini S&P 500 futures, day session only. While daily bars were used here, the same build approach applies to intraday data and to data for other types of symbols, such as stocks and forex. The data were divided 90%/10% between training and test, with the training period ending 6/15/2020. Trading costs of $30 per round turn were deducted, which accounts for one tick of slippage per side plus commissions. A population size of 300 with 50 generations was used. The other settings on the GP Settings window were left at their default values. All builds were run using 10 Monte Carlo samples of stress testing at 95% confidence, consisting of random price variations using the default settings.
The build metrics are shown below. A condition for the number of trades was added to make sure there were enough trades for reliable results. The average bars in wins was set to the range shown below in order to prevent trades from being either too short or too long.
                            Maximize Net Profit, weight 1.000
                            Maximize Corr Coeff, weight 1.000
                            Maximize Trade Sig, weight 1.000

                            No. Trades >=  200 (Train)
                            Ave Bars Wins between  5.00 and 20.00 (Train)
                            Corr Coeff >=  0.9500 (Train)
                            Trade Sig >=  95.00% (Train)
The order types selected for building the breakout strategies are shown below in Fig. 1. Order types marked in the "Include" column are included in each strategy. Order types marked in the "Consider" column are the ones the build process can select from when choosing orders for each strategy. The protective stop order, shown as "included" in Fig. 1, was not included in Example 1, as noted below.
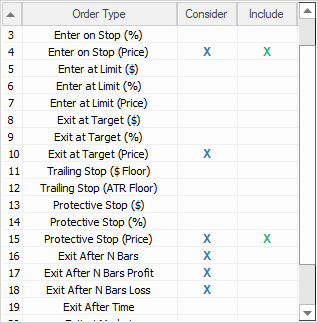
Figure 1. Order types for breakout strategies. Order types not shown in the figure were not selected.
The project files and code files in text file format are provided below following each example. The project files can be opened in Adaptrade Builder 4.2.1 or later. All code files are in EasyLanguage (TradeStation and MultiCharts). Key performance results are summarized for all examples below in Table 1.
Example 1: Nonsymmetric, no stop. This example includes different channel prices and entry and exit conditions for each side of the market, additional entry conditions, and no protective stop on the long side, where all the trades took place. Long trades are exited after 11 bars. The equity curve is shown in Figs. 2a and 2b. By allowing the build process to consider each side of the market separately, the strategy ended up biased towards the long side. All the top (fittest) strategies in the final population had the same long-only bias and consisted only of long trades.
This is an example where rebuilding may have resulted in a population where the profits were more evenly balanced between long and short trades. While there's nothing inherently wrong with a long-only strategy, given that the build symbol covers 22 years and includes several bear markets, a strategy that trades both sides of the market may be better overall in the long run. Another notable aspect of this strategy is how effective a simple exit after 11 bars was. The drawdown, largest loss, and largest maximum adverse excursion (MAE) are all fairly high with this strategy, but all the examples shown below could be improved in this regard, probably with the addition of one or more build metrics targeting the MAE or the largest loss. The MAE of a trade is the largest open loss during the trade. The maximum MAE is the largest MAE among all trades. An overly large MAE suggests the losses are not being cut off soon enough, which is more likely when there is no protective stop.
The remaining examples include a protective stop order.
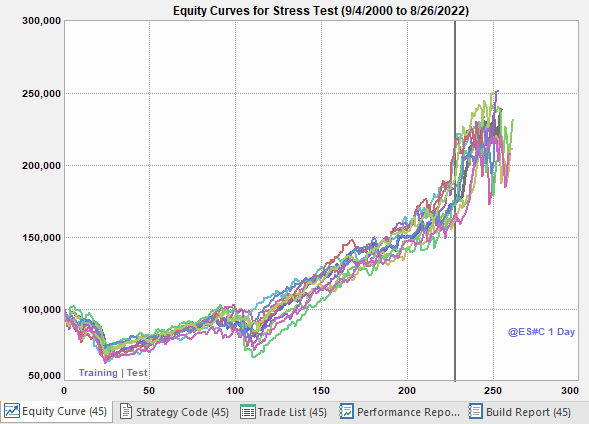
Figure 2a. Equity curve for breakout strategy Example 1, showing the stress testing (Monte Carlo) equity curves across both segments, training and test, shown separated by the vertical line. 10 Monte Carlo samples (equity curves) were used.
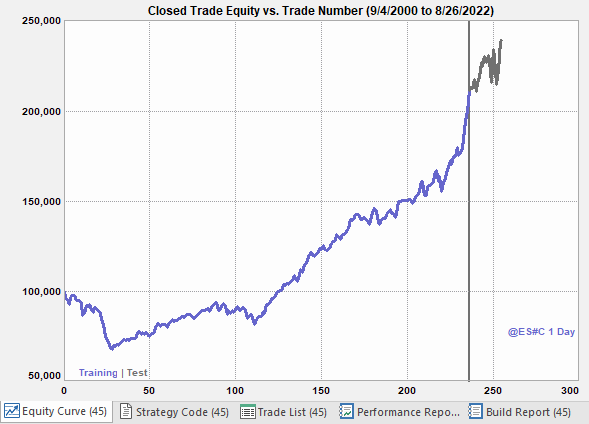
Figure 2b. Equity curve for breakout strategy Example 1 across both segments, training and test, shown separated by the vertical line.
Example 1 Downloads: Project File (.gpstrat); Code File (.txt)
Example 2: Nonsymmetric with stops. In setting up the build for this example, the only difference from the prior example is that the protective stop was selected as "Include" on the Order Types menu, which means all strategies in the resulting population included a protective stop. Like the previous example, this strategy used different entry channel prices for long and short trades and different conditions for entering long and short. Notably, this strategy is the only one of the five examples that was not profitable in the test (out-of-sample) segment; see Fig. 3b. It may be over-fit to the market as a result of having too many conditions and/or order parameters. Or the problem may be related to the very low percentage of winning trades (see Table 1), which may indicate less effective strategy logic. On the other hand, its poor test segment performance could simply be due to statistical bad luck. Rebuilding with the same settings could result in a more favorable population and outcome.
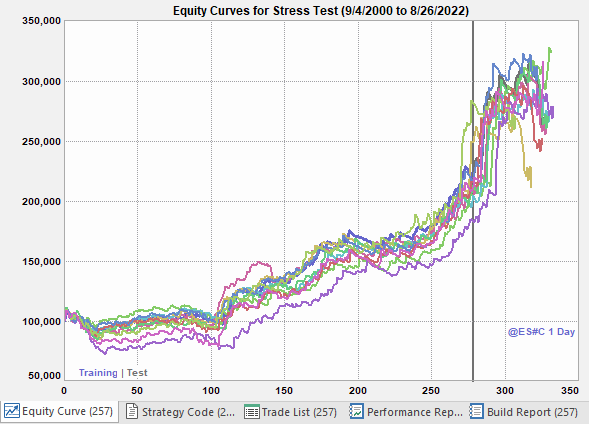
Figure 3a. Equity curve for breakout strategy Example 2, showing the stress testing (Monte Carlo) equity curves across both segments, training and test, shown separated by the vertical line. 10 Monte Carlo samples (equity curves) were used.
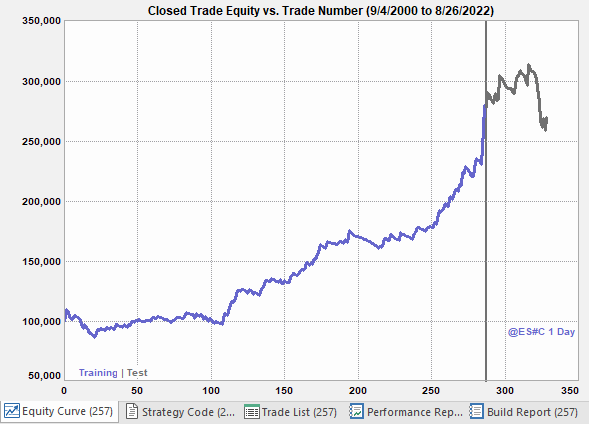
Figure 3b. Equity curve for breakout strategy Example 2 across both segments, training and test, shown separated by the vertical line.
Example 2 Downloads: Project File (.gpstrat); Code File (.txt)
Example 3: Symmetric with stops. As discussed above, requiring the entry channel prices to be symmetrical has the advantage of making the strategy simpler, which may make it more robust. Another related benefit is that it may generate a better balance between long and short trades. This example was built by selecting the symmetry option in Builder, which is available on the Strategy Logic menu. The results for this strategy do in fact provide a much better balance between long and short profits (refer to the project file for performance details). Also, as shown in Figs. 4a and 4b, the equity curve is the straightest so far, and the net profit is the highest of the five examples (see Table 1). The drawback is the large maximum loss and large maximum MAE. These appear to be trade-offs against the very high percentage of profitable trades (91%) and high profit factor (3.0). A better compromise between these metrics and the unfavorable ones may be possible by rebuilding with added conditions for the maximum MAE and/or largest loss.
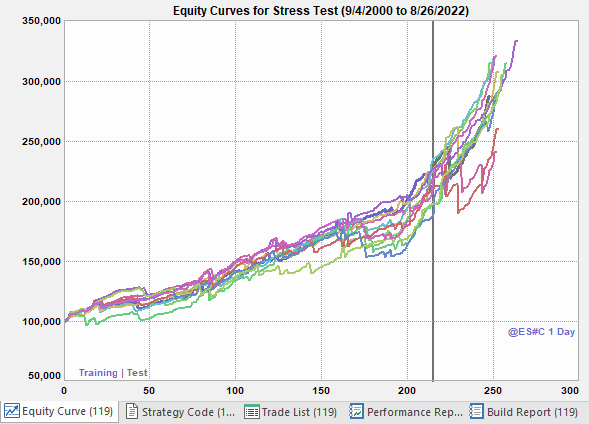
Figure 4a. Equity curve for breakout strategy Example 3, showing the stress testing (Monte Carlo) equity curves across both segments, training and test, shown separated by the vertical line. 10 Monte Carlo samples (equity curves) were used.
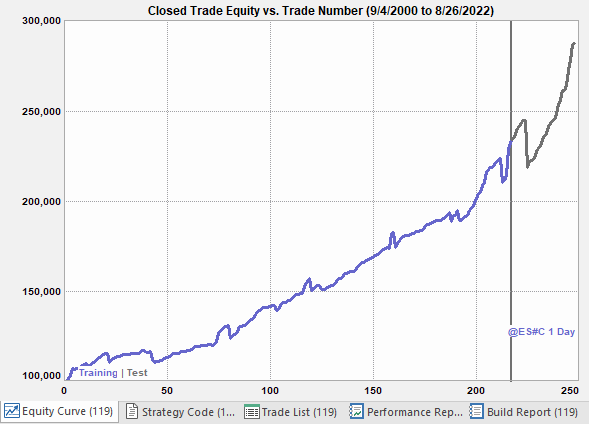
Figure 4b. Equity curve for breakout strategy Example 3 across both segments, training and test, shown separated by the vertical line.
The symmetrical entry channel for this strategy is shown below. It's based on a weighted moving average plus and minus a multiple of the average true range. The entry conditions are set to "true", which means they don't restrict the entry; i.e., the entry/channel prices are the only entry conditions. Notice that these channel prices are very similar to the Keltner channel, which is defined as a simple moving average plus or minus a multiple of the average true range. In effect, the build process "discovered" a variation of the Keltner channel. The channel prices are plotted below in Fig. 5, where several long and short trades are shown following breakouts above and below the channel boundaries.
                            AveTR = AvgTrueRange(NATR);

                            { Entry prices }
                            EntPrL = WAverage(L, NBarEnt1) + EntFr * AveTR;
                            EntPrS = WAverage(H, NBarEnt1) - EntFr * AveTR;

                            { Entry and exit conditions }
                            EntCondL = true;
                            EntCondS = true;
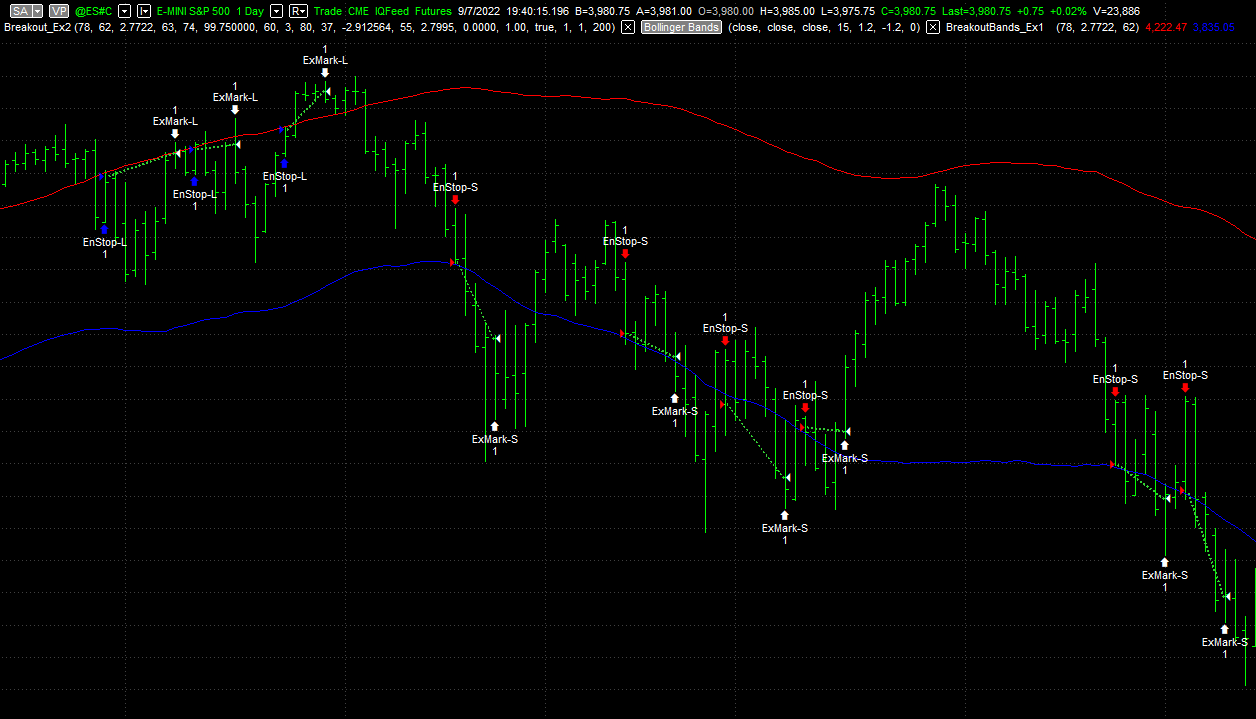
Figure 5. Price chart for example #3 with entry channels shown in red and blue for long and short trades, respectively. Long entries are indicated by a blue marker and short entries by a red marker.
Example 3 Downloads: Project File (.gpstrat); Code File (.txt)
Example 4: Keltner channel with stops. Bollinger bands and Keltner channels are among the classic channel indicators that are often used to define breakout strategies. To see if I could find a good strategy based on either of these indicators, I removed almost all other indicators from the indicators list other than true range, average true range, highest, lowest, crosses above/below, and absolute value. All other build settings were the same as in Example 3, including the symmetry condition. The result, not surprisingly, is a strategy similar to the strategy in the prior example. Instead of a channel defined by a weighted moving average — a variation of the Keltner channel, as explained above — the build process settled on the Keltner channel itself. The exits are different in this strategy (see code file below), and the channel is narrower in this strategy than in the prior example. The narrower channel seems to account for the lower percentage of profitable trades (see Table 1) due to the higher number of false breakouts, a few of which are shown below in Fig. 7. On the other hand, the maximum loss, drawdown, and MAE are all lower with this strategy than with the prior one.
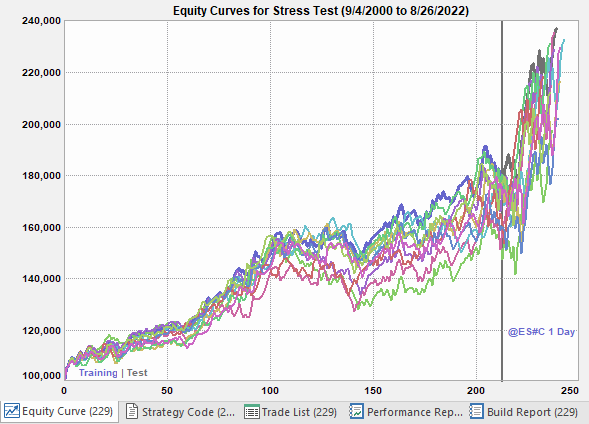
Figure 6a. Equity curve for breakout strategy Example 4, showing the stress testing (Monte Carlo) equity curves across both segments, training and test, shown separated by the vertical line. 10 Monte Carlo samples (equity curves) were used.
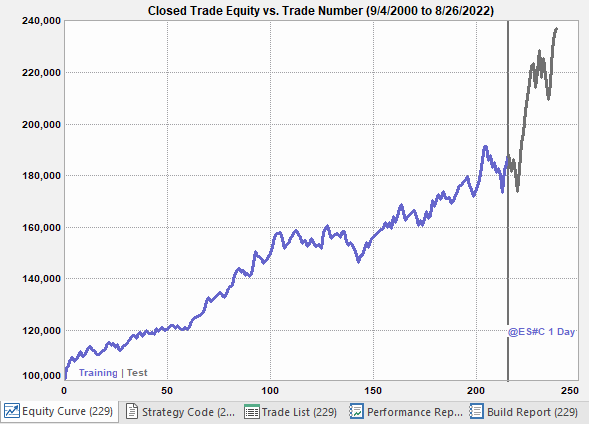
Figure 6b. Equity curve for breakout strategy Example 4 across both segments, training and test, shown separated by the vertical line.
The symmetrical Keltner channel for this strategy is shown below. Because the Keltner channel is a simple moving average plus or minus a multiple of the average true range, this entry logic is very similar to that of the previous example. The channel prices are plotted below in Fig. 7, where several long and short trades are shown following breakouts above and below the channel boundaries. Notice the false breakouts where the market failed to follow through in the direction of the breakout.
                            { Entry prices }
                            EntPrL = KeltnerChannel(H, NBarEnt1, NStdEnt1);
                            EntPrS = KeltnerChannel(L, NBarEnt1, -NStdEnt1);

                            { Entry and exit conditions }
                            EntCondL = true;
                            EntCondS = true;
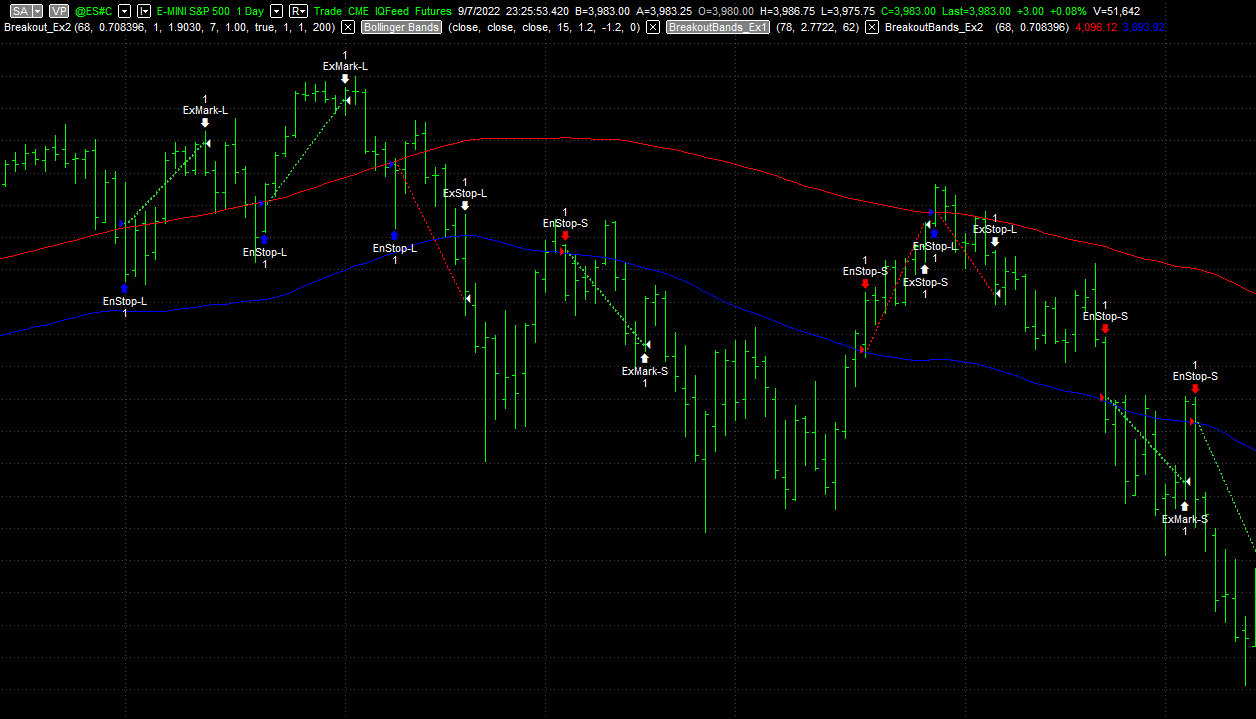
Figure 7. Price chart for example #4 with entry channels shown in red and blue for long and short trades, respectively. Long entries are indicated by a blue marker and short entries by a red marker. Several false breakouts are visible on the chart.
Example 4 Downloads: Project File (.gpstrat); Code File (.txt)
Example 5: Stop-and-reverse. The final example illustrates a stop-and-reverse strategy, where the long exit is the short entry for the next trade and vice-versa. There are no separate exits with this strategy since each entry exits the prior trade. To build such a strategy in Builder, it's necessary to (1) remove all order types from the Order Types list except for the stop entry order, and (2) deselect the option on the Strategy Logic menu to "Wait for exit before entering new trade". The remaining build settings were the same as for Example 3, including the symmetry condition.
Because trades reverse from long to short and back, there are exactly as many long trades as short ones. Given the upward bias in the market, this inevitably means the short trades are less profitable than the long ones. It also means there are many losing trades that are quickly reversed, some of which are visible on the price chart shown below in Fig. 9. Overall, this strategy has a very low percentage of winning trades (see Table 1). However, it does a good job of cutting losses short, resulting in a relatively low maximum MAE and largest loss. The accumulation of losses nonetheless leads to a large worst-case drawdown.
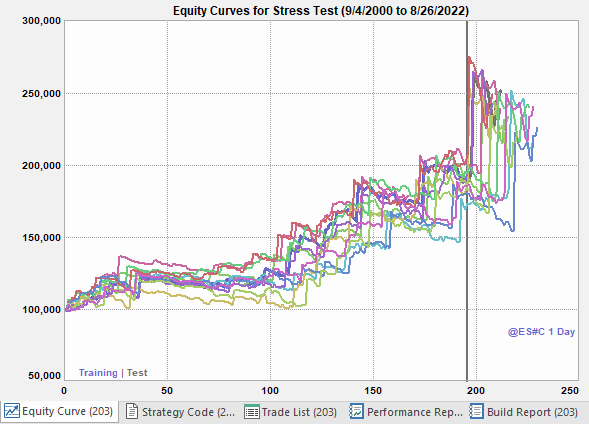
Figure 8a. Equity curve for breakout strategy Example 5, showing the stress testing (Monte Carlo) equity curves across both segments, training and test, shown separated by the vertical line. 10 Monte Carlo samples (equity curves) were used.
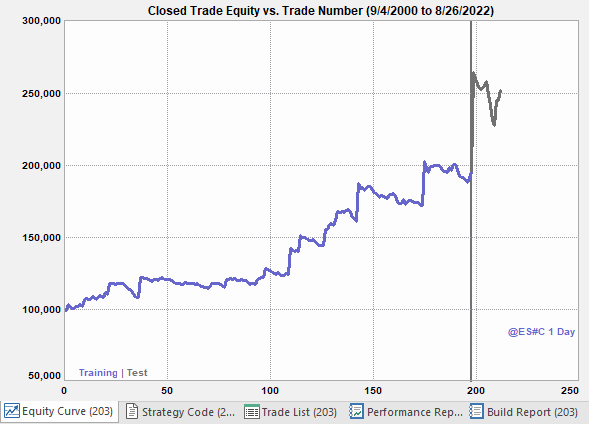
Figure 8b. Equity curve for breakout strategy Example 5 across both segments, training and test, shown separated by the vertical line.
The symmetrical channel for this strategy is shown below. It consists of a highest low/lowest high channel (note the atypical association of the Highest function with the low and the Lowest function with the high) offset by a price difference calculated from two weighted moving averages. The channel boundaries, plotted below in Fig. 9, appear to converge (and even cross over at times) when a change in trend occurs or appears to be imminent.
                            { Entry prices }
                            EntPrL = Highest(L, NBarEnt1) + EntFr * AbsValue(WAverage(O, NBarEnt2) - WAverage(L, NBarEnt3));
                            EntPrS = Lowest(H, NBarEnt1) - EntFr * AbsValue(WAverage(O, NBarEnt2) - WAverage(L, NBarEnt3));

                            { Entry and exit conditions }
                            VarL1 = Average(L, N1)[Shift1];
                            VarL2 = StandardDev(VarL1, N2, 1);
                            VarL3 = MACD(O, N3, N4);
                            VarL4 = AbsValue(VarL3);
                            VarS1 = Average(H, N1)[Shift1];
                            VarS2 = StandardDev(VarS1, N2, 1);
                            VarS3 = MACD(O, N3, N4);
                            VarS4 = AbsValue(VarS3);
                            EntCondL = VarL2 >= VarL4;
                            EntCondS = VarS2 >= VarS4;
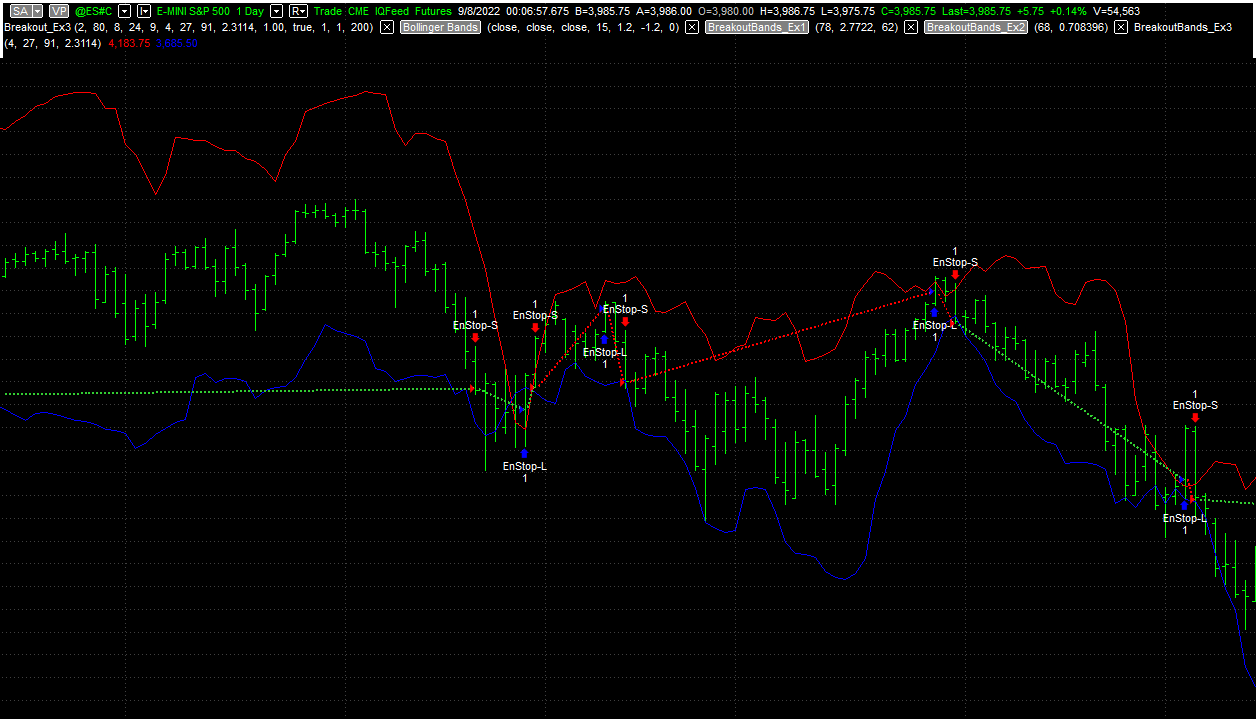
Figure 9. Price chart for example #5 with entry channels shown in red and blue for long and short trades, respectively. Long entries are indicated by a blue marker and short entries by a red marker. Notice how several trades quickly reverse to the other direction following false breakouts.
Example 5 Downloads: Project File (.gpstrat); Code File (.txt)
| Example | Net Profit | No. Trades | Ave Trade | Percent Wins | Profit Factor | Max Drawdown | Max MAE | Max Loss | Profit OOS? |
|---|---|---|---|---|---|---|---|---|---|
| Nonsymmetric, No Stop | $138,950 | 255 | $545 | 62.8% | 1.7 | $34,938 | $21,500 | $14,738 | Yes |
| Nonsymmetric, Stop | $169,538 | 328 | $517 | 33.5% | 1.6 | $65,250 | $17,075 | $15,625 | No |
| Symmetric, Stop | $187,513 | 248 | $756 | 91.5% | 3.0 | $33,900 | $30,775 | $26,175 | Yes |
| Keltner | $136,988 | 239 | $573 | 68.6% | 1.7 | $23,913 | $11,713 | $10,375 | Yes |
| Stop-and-Reverse | $151,675 | 212 | $715 | 36.8% | 1.9 | $52,738 | $14,238 | $9,975 | Yes |
Summary and Discussion
Several different types of breakout trading strategies were illustrated in the examples presented above. Of the five examples shown, all but one had positive out-of-sample results, suggesting that the approach outlined above may be an effective method for building breakout strategies.
The strategies based on long/short symmetry appeared to provide more reliable results. The fact that they generated more short trades suggests they may be less over-fit to the market. It may be that the symmetry condition is an effective form of so-called regularization. I discussed regularization in a prior newsletter article. In this case, it may be that forcing the strategy to use the same (or symmetric) logic for each side of the market may result in logic that is more generally applicable than if the build process were allowed to customize the logic for each side of the market. As a consequence, the strategy may be better able to generalize to unseen (out-of-sample) data.
Only one strategy example out of five had no protective stop. While its results were comparable to those of the other strategies, there are several reasons to include a protective stop in strategies. First, future losses may be larger than in the past, and a protective stop can provide a reasonable floor for losses. Secondly, when building strategies without a protective stop, it's more likely that the strategy's maximum MAE will be large. Even though that was not the case in the examples presented above — probably because the Max MAE, largest loss, and drawdown were not considered in the build metrics — when it occurs, it can make strategies difficult to trade in practice. No one wants to watch a profitable trade turn into a loss, knowing there is no downside protection if it doesn't turn around.
There is room for improvement in the examples presented above. As already noted, the largest loss, maximum MAE, and drawdown are arguably too high for all the examples. It should be possible to improve those metrics by adding a condition for the Max MAE or the largest loss, such as "Max MAE ≤ $10000". The symmetric strategy (Example 3) seemed to show the most promise, with strong out-of-sample results, a high winning percentage, and a high profit factor. Simply adding an extra condition and rebuilding may be all it takes to produce a fully tradable breakout strategy for daily bars of the E-mini S&P.
Good luck with your trading.
Mike Bryant
Adaptrade Software
This article appeared in the September 2022 issue of the Adaptrade Software newsletter.
HYPOTHETICAL OR SIMULATED PERFORMANCE RESULTS HAVE CERTAIN INHERENT LIMITATIONS. UNLIKE AN ACTUAL PERFORMANCE RECORD, SIMULATED RESULTS DO NOT REPRESENT ACTUAL TRADING. ALSO, SINCE THE TRADES HAVE NOT ACTUALLY BEEN EXECUTED, THE RESULTS MAY HAVE UNDER- OR OVER-COMPENSATED FOR THE IMPACT, IF ANY, OF CERTAIN MARKET FACTORS, SUCH AS LACK OF LIQUIDITY. SIMULATED TRADING PROGRAMS IN GENERAL ARE ALSO SUBJECT TO THE FACT THAT THEY ARE DESIGNED WITH THE BENEFIT OF HINDSIGHT. NO REPRESENTATION IS BEING MADE THAT ANY ACCOUNT WILL OR IS LIKELY TO ACHIEVE PROFITS OR LOSSES SIMILAR TO THOSE SHOWN.