
Adaptrade Software Newsletter Article
Building New Strategies Every Day for the E-mini S&P
Good trading strategies often take considerable time and effort to develop. For that reason, once a good strategy is found, it's often traded until its performance starts to degrade to the point where it either needs to be replaced or re-optimized. However, determining when a strategy is no longer viable is not always easy. For example, when is a drawdown just a normal drawdown and when is it the start of the breakdown of the strategy? If you wait too long, you'll continue to lose money. On the other hand, if you act too soon, you could be getting out right at the bottom of the drawdown before the strategy turns around. Moreover, this uncertainty could lead to a lack of confidence in the strategy, which could affect your ability to trade it properly.
One way to address this problem is to periodically build new trading strategies to replace the existing ones. For example, you might build new strategies every six months and start trading the new ones regardless of whether the current ones are still performing. The advantage is that you don't have to wait until losses in your account tell you it's time to switch strategies. The drawbacks include the difficulty of building new strategies as well as the uncertainty over whether the new ones are better than the current ones.
What if you could build new strategies every day and have confidence based on test results that the new strategies were worth trading? This would mean you'd be trading a new strategy every day, synced to the most recent market data up through and including the prior day. This is the approach I'll illustrate in this article. I'll test the viability of the idea by using a walk-forward strategy building process for 37 consecutive days, resulting in 30 trades, each from a strategy built specifically for that day. I'll show that the aggregate walk-forward results are on par with the in-sample results and provide a project file that can be used to repeat what I've done.
Why Don't Trading Strategies Last Forever?
Even the best trading strategies have a limited shelf life. Generally speaking, experience suggests that strategies based on lower frequency data (e.g., daily bars) tend to hold up longer than strategies based on higher frequency data (e.g., 5 minute bars). That's probably because the signals contained in lower frequency data tend themselves to be lower in frequency and therefore play out over a longer period of time. For example, a price pattern based on 25 bars of data takes over a month to complete on daily bars but only a day on 15 minute bars.
The reasons why market properties seem to change over time is subject to debate, but certainly over shorter timeframes, it's easy enough to see how sentiment in the market can shift, such as from bullish to bearish. Sometimes the cause is obvious, such as the release of an economic report from the government or a major corporate earnings announcement. In other cases, the cause is not readily apparent, but changes in the market's price behavior are nonetheless obvious.
Whatever the cause, the fact that tradable signals in price data don't last forever is a manifestation of a statistical characteristic called non-stationarity, which I discussed in a previous article . Non-stationary behavior in a market can quickly turn a winning trading strategy into a losing one, and the point at which the market changes is usually only visible in hindsight.
Daily Building With Walk-Forward Testing
While other approaches to handle non-stationary behavior in the markets are available (see, for example, my article on detecting strategy failure ), this article examines a more direct approach; namely, building a new strategy at the end of each day based on the most recent data up through the current day. With the right selection technique, the chosen strategy should be optimal for the next day's trading.
This approach is only possible with a systematic and repeatable method to quickly develop trading strategies prior to the next day's open. Automated strategy development tools, such as Adaptrade Builder, are well-suited to this problem. Adaptrade Builder uses an evolutionary algorithm1 to construct trading strategies by evolving a population of strategies over successive generations. The strategies combine indicators, price patterns, and other trading logic options based on the user's selections, and the evolutionary process continues until it meets (or gets as close as possible to) the user's performance specifications.
To demonstrate this approach, a walk-forward strategy building method will be followed. Walk-forward optimization2 usually refers to the process of optimizing the inputs to an existing trading strategy. The inputs are optimized over an in-sample segment of price data, such as 5000 bars, and tested forward over an out-of-sample segment, such as the following 500 bars. Both segments are then moved forward by the length of the out-of-sample segment, and the process is repeated. This results in multiple, consecutive out-of-sample segments. The results on the out-of-sample segments are used to evaluate the strategy.
There are several benefits to walk-forward optimization as well as a few potential drawbacks. One benefit is that you get multiple out-of-sample segments to use to evaluate the strategy, rather than just one as with standard optimization. Secondly, the walk-forward process can be used as a simulation of the optimization process you'd use in real time, giving you confidence that if you were to re-optimize the strategy the same way in real time as you did in the walk-forward test you'd get similar results in live trading. Also, by moving the in-sample (optimization) window forward with each optimization, the results are based on the most recent market data, which should help address the problem of non-stationary market data. However, this sliding window approach has a potential drawback. It limits the amount of data available for the optimization. Depending on the size of the in-sample segment, there may not be enough data to generate statistically valid results.
The problem of insufficient data in the optimization windows is sometimes addressed by "anchoring", which means the start of the optimization window is fixed, rather than moved forward at each step. So instead of a sliding window, you get an expanding optimization window. However, this makes each successive window larger than the previous one, which makes it difficult to compare out-of-sample results among windows and makes the whole process more difficult to interpret. Fortunately, for day trading strategies on relatively small bar sizes, such as we'll be using here, it's not difficult to set up the in-sample windows so that there is a sufficiently large number of trades in each window without anchoring.
Another problem with walk-forward optimization is the complexity of the process and how much time it takes as a back-testing technique. In real time, you only have to perform the optimization as often as the in-sample and out-of-sample windows are slid forward, but in back-testing, you have to perform multiple, consecutive optimizations and then aggregate the results from the out-of-sample segments. For example, for this article, as you'll see below, 37 different build processes were run, each with its own project file. Setting up the process so it was efficient enough to be practical was an essential step.
In applying the walk-forward technique to daily strategy building, we'll set the length of the in-sample segment to one year of data and the length of the out-of-sample segment to one day. At each step, both data segments will be moved forward one day, and new strategies will be built for the following day. The results from back-testing the new strategies on the out-of-sample segments (in other words, the results from back-testing each strategy on the day following the day on which it was built) will be combined into a set of aggregate statistics, which will be used to evaluate the overall approach.
Day Trading the E-mini S&P 500
To illustrate the approach described above, 15-minute bars of the E-mini S&P 500 futures (symbol ES) were obtained from IQFeed. The goal was to have one trade per day. 15-minute bars were chosen because this provides 27 bars of data per day using day session data for the ES contract. This provides enough bars to give the trade time to enter and exit within the same day so that each trade has a reasonable number of bars between entry and exit. Moving to a smaller bar size would also work but would make the strategy building process slower, and the smaller bars would potentially introduce more noise into the process.
The key settings used in Adaptrade Builder to build the strategies for each step of the walk-forward process are shown below.
E-mini S&P 500 futures, continuous contract, back-adjusted (IQFeed symbol @ES#C)
15-minute bars, day session (8:30 am - 3:15 pm exchange time)
$15 per round-turn trading costs
1 contract per trade
Market Sides: Long and short trades
Number of entries per day limited to 1
Trades enter between 8:30:00 AM and 2:15:00 PM
Trades exit after 3:00:00 PM
End-of-day Exit
Build Objectives and Conditions:
Maximize No. Trades, weight 0.750
Maximize Net Profit, weight 1.000
Maximize Corr Coeff, weight 0.500
Minimize Complexity, weight 0.200
Trade Sig ≥ 95.0000% (Train)
Corr Coeff ≥ 0.9500 (Train)
Prof Fact ≥ 1.700 (Train)
Ave Entry Efficiency ≥ 60.00% (Train)
Ave Exit Efficiency ≥ 60.00% (Train)
Max MAE ≤ $1,500.00 (Train)
Conditions for Selecting Top Strategies:
No. Trades ≥ 150 (Train)
Trade Sig ≥ 95.0000% (Train)
Corr Coeff ≥ 0.9000 (Train)
Prof Fact ≥ 1.700 (Train)
Ave Entry Efficiency ≥ 51.00% (Train)
Ave Exit Efficiency ≥ 55.00% (Train)
Max MAE ≤ $1,500.00 (Train)
Build Options:
Population Size: 500
No subpopulations
Reset population when building
Save 100 best strategies from population
Crossover Percentage: 60.00%
Mutation Percentage: 50.00%
Tree Depth: 3
Tournament Size: 2
Minimum Generations: 25
Maximum Generations: 25
All settings used to generate the results below are available in this project file , which can be opened in Adaptrade Builder version 2.4.1 . To see a list of all settings without opening the Builder project file, a text version of one of the build reports is available here .
Notice that one of the build objectives is to maximize the number of trades. Normally, I wouldn't include the number of trades as a build objective because doing so would increase the number of trades without consideration for other metrics. However, in this case, there can be at most one trade per day (not accounting for both long and short entries on the same bar, which is still possible). Since there is one year of training (in-sample) data, that means there can be no more than about 260 trades. I wanted to get as close as possible to this maximum.
As noted, the size of the training segment was one year. To represent the out-of-sample segment, I set the so-called validation segment in Builder to the day following the training segment. There was no test segment. While the test segment is often useful as a means of tracking the build process, which can be used to detect over-fitting, the goal in this case was to use all available data up to the out-of-sample segment for building. That way, the strategies would be based on the most recent data. To avoid over-fitting, I limited the build process to 25 generations.
At the end of the build process, the strategy to be tested on the out-of-sample period was selected by sorting the strategies in the Top Strategies population by the training fitness and selecting the fittest strategy. The results on the validation segment were then recorded as the out-of-sample results. Since the strategy options limited the strategy to one trade per day and the validation segment was only one day, there was at most one trade on each out-of-sample segment (no reversal trades were found, although this was allowed by the options). The dates for the next build were then set by moving the dates for both the training and validation segments forward one day. A separate Builder project file was saved for each build step of the walk-forward process. The settings in all files were the same except for the segment dates. The build process for each step took slightly less than five minutes on a four-core Windows 7 computer.
Build Results
The results of the walk-forward build process are shown below in the table. The dates and profit/loss amounts for both the in-sample (training) and walk-forward (out-of-sample or validation) segments are shown along with the cumulative profit/loss ("Total P/L"). My goal was to obtain 30 trades. Since seven days had no trade (shown in the table as days with a profit/loss value of "0"), it was necessary to extend the analysis to a total of 37 days in order to get exactly 30 trades. In several cases, there were no strategies in the Top Strategies population at the end of the build, so the build process was repeated. In all such cases, it only took one additional build to obtain at least one strategy in Top Strategies. In most cases, there were between a handful and a few dozen strategies in Top Strategies. Note that the dates in the table take weekends and holidays into account. Sessions that ended early, such as on July 3rd, were skipped.
| In-Sample | Walk-Forward | Profit/Loss | Total P/L | ||
|---|---|---|---|---|---|
| Start | End | Date | In-Sample | Walk-Forward | |
| 5/18/2017 | 5/18/2018 | 5/21/2018 | 21027.50 | -165.00 | -165.00 |
| 5/19/2017 | 5/21/2018 | 5/22/2018 | 28167.50 | -202.50 | -367.50 |
| 5/22/2017 | 5/22/2018 | 5/23/2018 | 16922.50 | 335.00 | -32.50 |
| 5/23/2017 | 5/23/2018 | 5/24/2018 | 10920.00 | 22.50 | -10.00 |
| 5/24/2017 | 5/24/2018 | 5/25/2018 | 25867.50 | -290.00 | -300.00 |
| 5/25/2017 | 5/28/2018 | 5/29/2018 | 29322.50 | -377.50 | -677.50 |
| 5/26/2017 | 5/29/2018 | 5/30/2018 | 14420.00 | 110.00 | -567.50 |
| 5/29/2017 | 5/30/2018 | 5/31/2018 | 34645.00 | 222.50 | -345.00 |
| 5/30/2017 | 5/31/2018 | 6/1/2018 | 15825.00 | 460.00 | 115.00 |
| 5/31/2017 | 6/1/2018 | 6/4/2018 | 14512.50 | 235.00 | 350.00 |
| 6/1/2017 | 6/4/2018 | 6/5/2018 | 21967.50 | 0 | 350.00 |
| 6/2/2017 | 6/5/2018 | 6/6/2018 | 19285.00 | 772.50 | 1122.50 |
| 6/5/2017 | 6/6/2018 | 6/7/2018 | 22580.00 | 0 | 1122.50 |
| 6/6/2017 | 6/7/2018 | 6/8/2018 | 37845.00 | 422.50 | 1545.00 |
| 6/7/2017 | 6/8/2018 | 6/11/2018 | 19110.00 | -190.00 | 1355.00 |
| 6/8/2017 | 6/11/2018 | 6/12/2018 | 15882.50 | -152.50 | 1202.50 |
| 6/9/2017 | 6/12/2018 | 6/13/2018 | 22457.50 | 0 | 1202.50 |
| 6/12/2017 | 6/13/2018 | 6/14/2018 | 16752.50 | 122.50 | 1325.00 |
| 6/13/2017 | 6/14/2018 | 6/15/2018 | 21045.00 | -15.00 | 1310.00 |
| 6/14/2017 | 6/15/2018 | 6/18/2018 | 33800.00 | 0 | 1310.00 |
| 6/15/2017 | 6/18/2018 | 6/19/2018 | 24102.50 | 347.50 | 1657.50 |
| 6/16/2017 | 6/19/2018 | 6/20/2018 | 22920.00 | -65.00 | 1592.50 |
| 6/19/2017 | 6/20/2018 | 6/21/2018 | 26375.00 | 560.00 | 2152.50 |
| 6/20/2017 | 6/21/2018 | 6/22/2018 | 22122.50 | -2.50 | 2150.00 |
| 6/21/2017 | 6/22/2018 | 6/25/2018 | 25595.00 | -765.00 | 1385.00 |
| 6/22/2017 | 6/25/2018 | 6/26/2018 | 16382.50 | 347.50 | 1732.50 |
| 6/23/2017 | 6/26/2018 | 6/27/2018 | 22677.50 | -577.50 | 1155.00 |
| 6/26/2017 | 6/27/2018 | 6/28/2018 | 20180.00 | 0 | 1155.00 |
| 6/27/2017 | 6/28/2018 | 6/29/2018 | 12757.50 | 35.00 | 1190.00 |
| 6/28/2017 | 6/29/2018 | 7/2/2018 | 19202.50 | 0 | 1190.00 |
| 6/30/2017 | 7/3/2018 | 7/5/2018 | 22267.50 | 0 | 1190.00 |
| 7/3/2017 | 7/5/2018 | 7/6/2018 | 33745.00 | 610.00 | 1800.00 |
| 7/5/2017 | 7/6/2018 | 7/9/2018 | 26327.50 | -240.00 | 1560.00 |
| 7/6/2017 | 7/9/2018 | 7/10/2018 | 18487.50 | -115.00 | 1445.00 |
| 7/7/2017 | 7/10/2018 | 7/11/2018 | 22530.00 | 35.00 | 1480.00 |
| 7/10/2017 | 7/11/2018 | 7/12/2018 | 35005.00 | 347.50 | 1827.50 |
| 7/11/2017 | 7/12/2018 | 7/13/2018 | 26827.50 | -140.00 | 1687.50 |
In order to aggregate the out-of-sample (walk-forward) results, I read the results into Market System Analyzer (MSA) . Since each line in the table above represents one trade, the table can be read directly as a file of trade data. The equity curve corresponding to the out-of-sample results is shown below in Fig. 1.
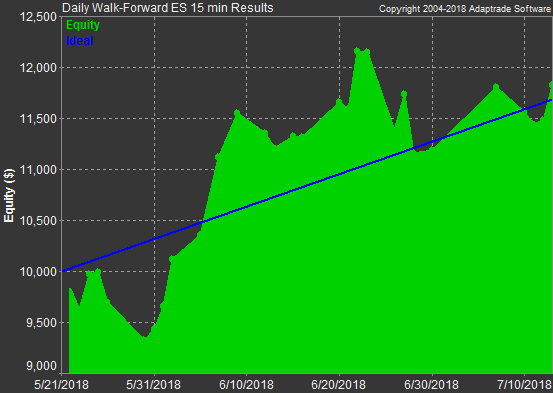
Figure 1. Equity curve corresponding to the 1-day walk-forward periods for daily strategy building for 15-minute bars of the E-mini S&P 500.
The summary statistics for the results shown in Fig. 1 are given below.
Position Sizing: Fixed Contracts
No. Contracts: 1
Starting Equity: $10,000.00
Equity High: $12,152.50
Equity Low: $9,322.50
Net Profit: $1,687.50
Final Equity: $11,687.50
Account Return: 16.87%
Ave Daily PL: $31.84
Ave Monthly PL: $969.12
Total Trades: 30
Wins: 16
Losses: 14
Pct Wins: 53.33%
Max $ Win: $772.50
Ave $ Win: $311.56
Max Consec Wins: 6
Max $ Loss: ($765.00)
Ave $ Loss: ($235.54)
Max Consec Losses: 2
$ Win/Loss Ratio: 1.323
Ave $ Trade: $56.25
Max $ Drawdown: ($997.50)
Max % Drawdown: 8.21%
Prof Fact: 1.512
Ret/DD Ratio: 2.056
The equity curve for one of the builds for which the walk-forward trade was successful is shown below in Fig. 2. The small part of the curve to the right of the vertical line (in green) is the walk-forward (out-of-sample) trade on 5/31/2018.
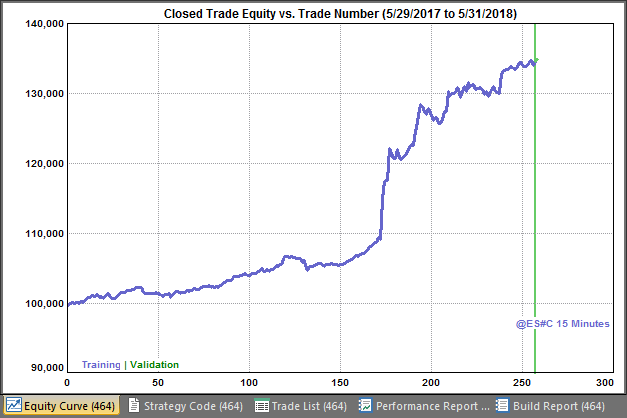
Figure 2. Equity curve for one step of the daily build process for day trading 15-minute bars of the E-mini S&P 500 futures.
The last few trades, including the out-of-sample trade on 5/31/2018, are shown below on the price chart in Fig. 3.
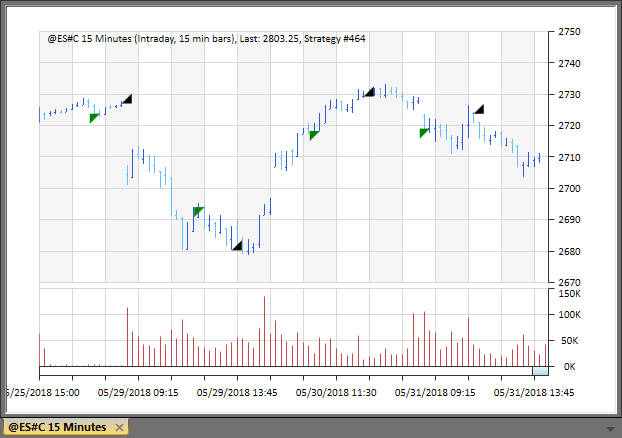
Figure 3. 15-minute bars of the E-mini S&P 500 futures showing strategy trades corresponding to the equity curve in Fig. 2. The trade at right is from the out-of-sample segment.
Variations in Strategy Logic and Rules
Since the process involves building new strategies for each trading day, each trade in the out-of-sample segments comes from a different strategy. This raises the question of whether the strategies were in fact different or was there so little difference in data from moving the data window forward one day that the strategies on consecutive days were the same or similar. The table below shows the entry type, exit type, strategy complexity, and whether the trade was long or short for each out-of-sample period. The exit type represents the exit order that was triggered for that trade. The names correspond to the the types of exit orders available in Adaptrade Builder. "NA" indicates no trade was recorded in the segment on that day.
| OOS Date | Long/Short | Entry Type | Exit Type | Complexity |
|---|---|---|---|---|
| 5/21/2018 | Long | Stop | N Bars | 21 |
| 5/22/2018 | Long | Stop | Bars Loss | 20 |
| 5/23/2018 | Long | Stop | Time | 18 |
| 5/24/2018 | Short | Limit | Time | 19 |
| 5/25/2018 | Long | Stop | Bars Loss | 22 |
| 5/29/2018 | Short | Stop | Market | 18 |
| 5/30/2018 | Long | Market | Fix Targ | 19 |
| 5/31/2018 | Long | Market | N Bars | 11 |
| 6/1/2018 | Long | Market | Bars Prof | 20 |
| 6/4/2018 | Long | Market | Market | 16 |
| 6/5/2018 | NA | NA | NA | 14 |
| 6/6/2018 | Long | Stop | Time | 16 |
| 6/7/2018 | NA | NA | NA | 18 |
| 6/8/2018 | Long | Market | Bars Prof | 24 |
| 6/11/2018 | Long | Stop | Time | 25 |
| 6/12/2018 | Long | Stop | Market | 18 |
| 6/13/2018 | NA | NA | NA | 23 |
| 6/14/2018 | Long | Market | Market | 21 |
| 6/15/2018 | Long | Stop | Time | 18 |
| 6/18/2018 | NA | NA | NA | 25 |
| 6/19/2018 | Long | Stop | Time | 18 |
| 6/20/2018 | Long | Stop | Bars Loss | 15 |
| 6/21/2018 | Short | Stop | N Bars | 23 |
| 6/22/2018 | Long | Limit | Bars Prof | 15 |
| 6/25/2018 | Long | Market | Fix Stop | 22 |
| 6/26/2018 | Long | Stop | Bars Prof | 18 |
| 6/27/2018 | Long | Limit | N Bars | 21 |
| 6/28/2018 | NA | NA | NA | 17 |
| 6/29/2018 | Long | Stop | Bars Prof | 16 |
| 7/2/2018 | NA | NA | NA | 19 |
| 7/5/2018 | NA | NA | NA | 13 |
| 7/6/2018 | Long | Stop | Trail $ | 20 |
| 7/9/2018 | Short | Market | N Bars | 13 |
| 7/10/2018 | Long | Stop | Bars Loss | 17 |
| 7/11/2018 | Short | Stop | Time | 17 |
| 7/12/2018 | Long | Stop | Time | 20 |
| 7/13/2018 | Long | Stop | N Bars | 22 |
As shown above, there is considerable variety in the types of orders and in the complexity of strategies generated from one day to the next.
Discussion
Traders want to know how to trade profitably. Historical testing is subject to the benefit of hindsight, and optimization is prone to over-fitting. Even out-of-sample results are difficult to evaluate because we know that markets constantly change. Even if the out-of-sample results are valid when generated, they may be difficult to duplicate in the future. Walk-forward optimization, when it works without over-fitting, provides more reliable results than a single out-of-sample result but typically only applies to the inputs to an existing trading strategy, which itself may be over-fit.
The approach presented above addresses these problems. By applying a walk-forward approach to the entire strategy building process, the benefits of walk-forward optimization can be extended to strategy building. Moreover, by building new strategies every day, the uncertainty over whether the strategy is still in sync with the market is eliminated, and there's no need to track the strategy for failure detection. Building every day eliminates the need to decide when to rebuild.
The build-every-day approach is made possible by having an automated tool that systematizes and accelerates the build process. As noted above, it took only about five minutes to perform each build, not counting the handful of cases where a second build was necessary to populate the Top Strategies tables. This means it would not be a burden on the trader to build a new strategy every day. The short build times resulted from the choice of bar size, the length of the in-sample data segment, and the choice of build settings. By maximizing the number of trades, given the restriction of one trade per day, the 12 months of 15-minute bars in the in-sample segment were fully utilized, which provided an adequate number of trades for statistical significance with the least amount of price data.
The walk-forward testing process has the advantage of providing multiple out-of-sample periods. Above, 30 out-of-sample periods contained a trade. While 30 trades may not seem like a large sample size, the aggregate results, as given by the equity curve in Fig. 1 and the associated summary statistics, represent a tradable strategy (actually, "meta-strategy" may be a more accurate term given that there are multiple strategies involved). The period chosen for back-testing was not cherry-picked; it was simply the most recent data available at the start of the analysis. To get a full 30 trades -- an admittedly arbitrary number but one generally associated with providing a minimally adequate sample size -- I had to add additional segments at the beginning, rather than continuing to walk forward. However, since all periods are independent, this doesn't affect the results.
To provide an objective and repeatable process for the purposes of this article, I stopped each build at 25 generations and took the strategy in Top Strategies with the highest in-sample fitness. In live trading, some traders might prefer to add some discretion to the process. For example, you could build a population of strategies up through and including the current day's close and use some judgment and discretion in selecting the strategy to trade the next day. Whatever approach is taken, it would be prudent to validate it by walking it forward like I did above or, better yet, using real-time tracking over the course of several weeks with live data.
References
- Eiben, A. E. and Smith, J. E. Introduction to Evolutionary Computing, Springer-Verlag, Berlin, 2010, pp. 37-69
- Pardo, R. Design, Testing, and Optimization of Trading Systems , John Wiley & Sons, Inc., New York, 1992.
Good luck with your trading.
Mike Bryant
Adaptrade Software
This article appeared in the July 2018 issue of the Adaptrade Software newsletter.
HYPOTHETICAL OR SIMULATED PERFORMANCE RESULTS HAVE CERTAIN INHERENT LIMITATIONS. UNLIKE AN ACTUAL PERFORMANCE RECORD, SIMULATED RESULTS DO NOT REPRESENT ACTUAL TRADING. ALSO, SINCE THE TRADES HAVE NOT ACTUALLY BEEN EXECUTED, THE RESULTS MAY HAVE UNDER- OR OVER-COMPENSATED FOR THE IMPACT, IF ANY, OF CERTAIN MARKET FACTORS, SUCH AS LACK OF LIQUIDITY. SIMULATED TRADING PROGRAMS IN GENERAL ARE ALSO SUBJECT TO THE FACT THAT THEY ARE DESIGNED WITH THE BENEFIT OF HINDSIGHT. NO REPRESENTATION IS BEING MADE THAT ANY ACCOUNT WILL OR IS LIKELY TO ACHIEVE PROFITS OR LOSSES SIMILAR TO THOSE SHOWN.