|
||
|
||
|
|
|
|
Trading Strategy Failure Detection Using Monte Carlo Prediction by Michael R. Bryant
Knowing when to stop trading a strategy is arguably as important as developing it in the first place. Even the best trading strategies tend to have a limited lifespan. Markets change, and a trading strategy that can't accommodate that change will get out of sync with the market and start to lose money. Unless you have a way to identify when a strategy is no longer in sync with the market, months of profitable trading can be undone very quickly.
It might be tempting to think "I'll just stop trading my strategy when it's no longer working". But how do you know when a strategy has stopped working? The statistical nature of trading strategies makes it difficult to distinguish a normal drawdown or losing streak from the behavior of a broken system.
In this article, a graphical method based on the equity curve will be used to detect strategy failure. The basic idea is to predict where the strategy's equity curve will be over the next period of trading based on the assumption that it will continue to trade as it has. If it trades outside of the "prediction envelope," it can be concluded that the strategy is no longer trading normally. If it trades below the envelope, it may be time to stop trading the strategy.
Predicting the Equity Curve The first step is to predict the trading system's equity curve over the next N trades, where N might be on the order of 30 trades or so.* How do we do this? Since the purpose of the prediction is to detect when the strategy is no longer working as it has, it's logical to use the past to extrapolate the future.
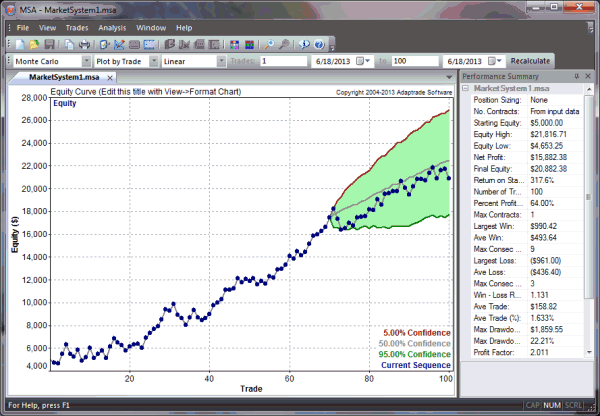
Consider Fig. 1, below, which depicts an equity curve consisting of 100 trades. A prediction envelope encompassing the last 30 trades is shown in green. The example uses Market System Analyzer (MSA), which includes this type of analysis as a built-in option. To construct the prediction envelope, the following procedure is used:
Figure 1. Prediction envelope encompassing the last 30 trades of the equity curve.
If the specified confidence level is 95%, for example, the region shaded green -- the prediction envelope -- includes 90% of the predicted equity values; 5% of calculated values are above the upper curve, and 5% are below the lower curve.
This approach to constructing the prediction envelope is called Monte Carlo analysis using a sampling method called random selection with replacement. It's based on the assumption that the first 70 trades in the sequence for this example define the statistical distribution of trades for the trading strategy being analyzed. Because these trades define the trade distribution, we can sample from them to construct other possible equity curves going forward.
Repeating the process, as outlined above, allows us to define a range of possible equity curves. And because the calculated range of possible equity curves is based on what we've deemed to be the normal behavior of our trading strategy, the prediction envelope defines the range of probable behavior of the strategy.
The last step is to compare the actual trades that took place over the predicted range -- in this example, trades 71 to 100 -- to the prediction envelope. The prediction envelope is basically an extrapolation of the trades that came before it. If the trades that actually occurred over this range fall within the envelope, we can conclude that the strategy is trading normally. In statistical terms, the trades still belong to the same trade distribution.
As shown above in Fig. 1, this is the case for our example. The actual sequence of trades 71 to 100, shown by the dark blue line, lies within the prediction envelope constructed from trades 1 to 70, suggesting that the strategy is still trading consistent with past performance.
An Example of Strategy Failure To show how this method works when a trading strategy has failed, consider the following example. A trading strategy was built for the E-mini S&P futures using Adaptrade Builder. Five years of daily bars (day session only) were used with $25 per round turn per contract deducted for trading costs. Adaptrade Builder uses a genetic programming algorithm to evolve a population of strategies over successive generations. In this example, a population of 1000 strategies was evolved over 50 generations.
The strategies were built over three years of data (6/4/2008 to 6/5/2011), with one year for out-of-sample testing (6/6/2011 to 6/4/2012) and one year set aside for validation (6/5/2012 to 6/4/2013).
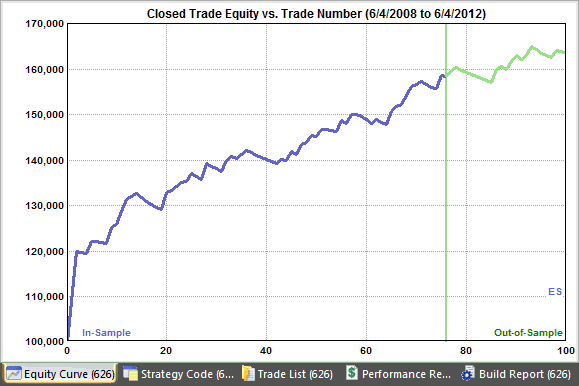
The top strategy in the population was adequately profitable in all three segments -- in-sample, out-of-sample and validation -- making it unsuitable as an example of strategy failure. However, looking further down the list of strategies in the population, the strategy shown below in Fig. 2 was found.
Figure 2. E-mini S&P trading strategy showing in-sample and out-of-sample performance (validation segment not shown).
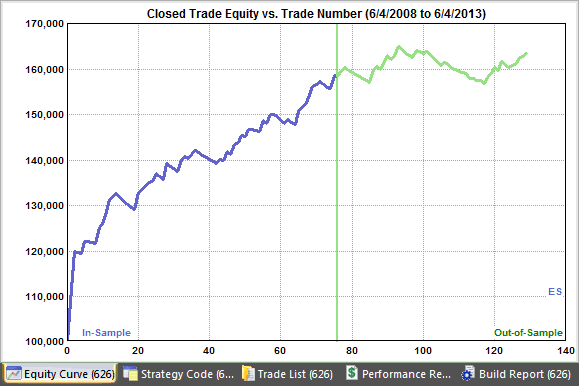
As shown in the figure, the in-sample and out-of-sample segments show consistent performance. Now consider the equity curve for the same strategy when the validation segment is added. As shown below in Fig. 3, the equity curve is the same as in Fig. 2 up through trade 100. Trades 101 through 129, however, are part of the validation segment. There is clearly a drawdown near the beginning of the validation segment. However, the strategy appears to recover over the last 10 trades or so.
Figure 3. E-mini S&P trading strategy showing in-sample, out-of-sample, and validation segment performance. The validation segment consists of the last 29 trades.
The question is whether the performance in the validation segment is acceptable or not. The fact that the strategy appears to recover after the drawdown makes it difficult to determine whether or not the strategy has failed. The Monte Carlo prediction envelope method can be used to answer this question.
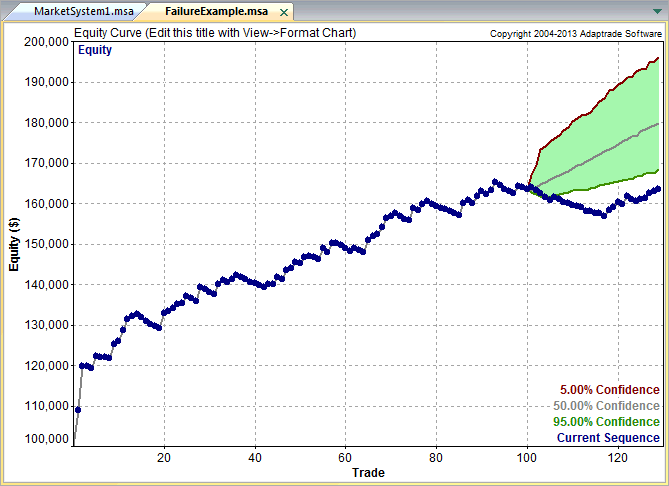
After saving the Builder strategy to a MSA file, it was opened in MSA, and a Monte Carlo analysis was run using the option to "Predict equity curve over last [29] trades" with 500 Monte Carlo samples and a confidence level of 95%. The resulting prediction envelope for the validation segment (the last 29 trades) is shown below in Fig. 4.
Figure 4. Monte Carlo-based prediction envelope for the last 29 trades for the E-mini S&P trading strategy, showing that the equity curve for trades in the validation segment falls below the envelope.
As shown in the figure, despite the up-tick in equity over the last few trades, the equity curve lies below the lower boundary of the prediction envelope, suggesting that the strategy has failed. In statistical terms, the trades in the validation segment appear not to belong to the same statistical distribution of trades that preceded the validation segment.
This strategy failure can also be explained as follows: The equity curve prior to the validation segment displays relatively little volatility. The drawdowns are modest, and the equity curve follows a fairly straight trajectory. As a result, the prediction envelope is fairly narrow, and the drawdown at the start of the validation segment is so large that the equity curve is unable to rise back above the lower boundary of the envelope. If the history prior to the validation period had been more volatile, it's possible that the envelope would have been large enough to encompass the equity curve in the validation period.
Conclusions It's been said that the job of a systematic trader is to trade his/her system. Systematic trading has the advantage of reducing emotion from trading because the trading system tells you when to buy or sell, eliminating the difficult decision of when to "pull the trigger." However, this only complicates matters when a trading system starts to fail. A conflict arises between the need to follow the system without question and the need to stop following the system when it's no longer working.
The method developed in this article provides a way to address that conflict. It presents a technical, objective method to determine when a trading strategy is no longer working and should be modified or taken offline. The prediction envelope method extrapolates the past trade history using Monte Carlo analysis and compares the actual equity curve to the range of probable equity curves based on the extrapolation.
Of course, there are other possible ways to test for strategy failure. The equity curve can be compared to its moving average, for example, and trading can be stopped when it crosses below the moving average. However, this is not a statistical test and has no confidence level associated with it. Alternatively, a performance statistic, such as the percentage of winning trades, profit factor, or number of consecutive losses, could be compared using hypothesis testing to determine if the means are statistically different between two time periods, such as the last 30 trades relative to the prior trade history.
The Monte Carlo-based envelope approach, however, has the advantage of sampling directly from the prior trade history in order to derive its statistical conclusions, rather than relying on the usual assumptions inherent in statistical formulae. The envelope approach also has the advantage of being visual, which makes identifying strategy failure as easy as noticing when the equity curve falls below the envelope.
By their nature, trading strategies are statistical; there's an element of randomness to their performance. It's this characteristic that makes it difficult to determine when a strategy has failed. Rather than identifying failure based on whether or not you can sleep at night worrying about the current losing streak your strategy is on, the Monte Carlo-based prediction envelope method described in this article may make your life as a systematic trader a little easier.
Mike Bryant Adaptrade Software * 30 trades is relatively arbitrary number chosen based on the fact that it takes roughly that many samples to minimally define a statistical distribution.
This article appeared in the June 2013 issue of the Adaptrade Software newsletter.
HYPOTHETICAL OR SIMULATED PERFORMANCE RESULTS HAVE CERTAIN INHERENT LIMITATIONS. UNLIKE AN ACTUAL PERFORMANCE RECORD, SIMULATED RESULTS DO NOT REPRESENT ACTUAL TRADING. ALSO, SINCE THE TRADES HAVE NOT ACTUALLY BEEN EXECUTED, THE RESULTS MAY HAVE UNDER- OR OVER-COMPENSATED FOR THE IMPACT, IF ANY, OF CERTAIN MARKET FACTORS, SUCH AS LACK OF LIQUIDITY. SIMULATED TRADING PROGRAMS IN GENERAL ARE ALSO SUBJECT TO THE FACT THAT THEY ARE DESIGNED WITH THE BENEFIT OF HINDSIGHT. NO REPRESENTATION IS BEING MADE THAT ANY ACCOUNT WILL OR IS LIKELY TO ACHIEVE PROFITS OR LOSSES SIMILAR TO THOSE SHOWN. |
If you'd like to be informed of new developments, news, and special offers from Adaptrade Software, please join our email list. Thank you.
For Email Marketing you can trust
|
|||||||||||||
|
|
|
|
|||||||||||||
Copyright (c) 2004-2019 Adaptrade Software. All rights reserved.