
Detailed Performance Analysis
Market System Analyzer (MSA) is a trading software application that calculates a wide array of performance statistics for trading strategies. The performance statistics in MSA provide a detailed description of your strategy's performance. MSA can be used to evaluate trading systems and methods, optimize trade sizes, perform position sizing calculations on a trade by trade basis, and perform Monte Carlo simulation and other types of analyses.
The performance summaries available in most trading software packages, such as TradeStation,™ are generally based on the assumption that a fixed number of shares/contracts is being traded; e.g., one contract per trade. Performance statistics such as the average trade, largest loss, and drawdown are quoted in dollars. However, when position sizing is incorporated into a trading simulation, the number of contracts or shares tends to increase over time as trading profits accrue.
As the number of shares/contracts increases, so does the drawdown. A drawdown of 10% is $3,000 on a $30,000 account, but if the account grows to $200,000, a 10% drawdown is $20,000. Given the dollar value of the drawdown without the corresponding percentage, is that $20,000 drawdown a 67% drawdown on the starting equity of $30,000 or a 10% drawdown on the same account after it grew to $200,000? The point is that the more important statistic is the percentage drawdown, not the absolute dollar value.
The same is true of the average trade size and a number of other statistics. The solution is to track trading results relative to account equity. That way, regardless of whether the position sizing is based on one contract or the fixed ratio method, the performance statistics will be meaningful and the account size and position sizing will be properly represented. MSA is designed to properly account for position sizing and trading equity to provide a more accurate trading simulation than programs based on a fixed number of shares or contracts.
Market System Analyzer provides a detailed list of performance statistics based on account equity and expressed in percentage terms. The statistics are computed for the current sequence of trades, as displayed in the main chart window. If any change is made to the current sequence, such as changing the position sizing method or adding a dependency rule, the performance statistics are automatically updated. The performance statistics can be viewed at any time by selecting Performance Results from the View menu. An example is shown below for a portfolio (equivalent results are displayed for market systems).
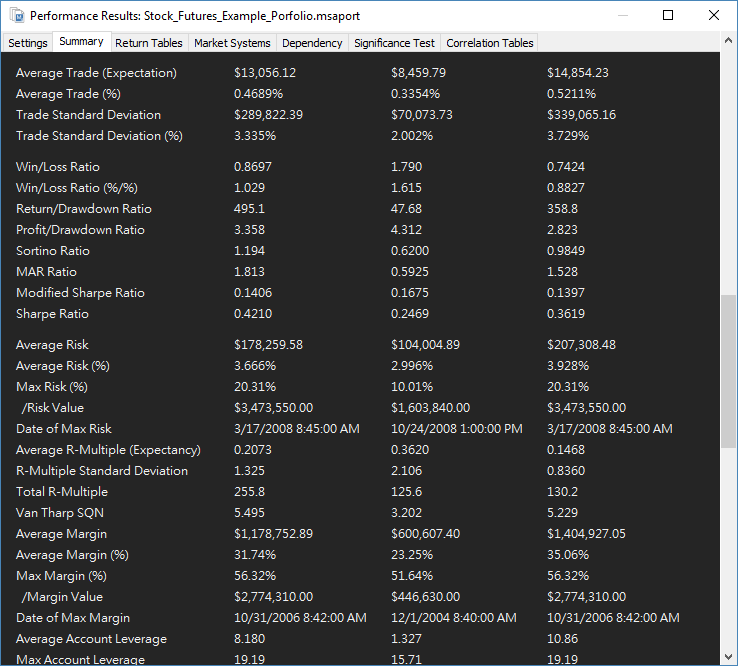
The Performance Results window in Market System Analyzer displays the performance results for the current sequence of trades.
The performance results include the following statistics:
Gross Profit
Gross Loss
Total Net Profit
Profit Factor
Pessimistic Return Ratio
Trading Period
Highest Closed Trade Equity
Lowest Closed Trade Equity
Additions to Equity
Withdrawals from Equity
Final Account Equity
Return on Starting Equity
Total Number of Trades
Number of Winning Trades
Number of Losing Trades
Trades Not Taken
Percent Profitable
Max Number of Shares/Contracts
Minimum Number of Shares/Contracts
Average Number of Shares/Contracts
Total Number of Shares/Contracts
Max Number of Open Positions
Average Number of Open Positions
Largest Winning Trade
Largest Winning Trade (%)
Average Winning Trade
Average Winning Trade (%)
Average R-Multiples, Wins
Average Length of Wins
Max Number Consecutive Wins
Largest Losing Trade
Largest Losing Trade (%)
Average Losing Trade
Average Losing Trade (%)
Average R-Multiples, Losses
Average Length of Losses
Max Number Consecutive Losses
Average Trade (Expectation)
Average Trade (%)
Trade Standard Deviation
Trade Standard Deviation (%)
Win/Loss Ratio
Win/Loss Ratio (%/%)
Return/Drawdown Ratio
Profit/Drawdown Ration
Sortino Ratio
MAR Ratio
Modified Sharpe Ratio
Sharpe Ratio
Average Risk
Average Risk (%)
Max Risk (%)
Date of Max Risk
Average R-Multiple (Expectancy)
R-Mulitple Standard Deviation
Total R-Multiple
Van Tharp SQN
Average Margin
Average Margin (%)
Max Margin (%)/Margin Value
Date of Max Margin
Average Account Leverage
Max Account Leverage
Date of Max Account Leverage
Risk of Ruin
Average Annual Profit/loss
Ave Annual Compounded Return
Average Monthly Profit/loss
Ave Monthly Compounded Return
Average Weekly Profit/loss
Ave Weekly Compounded Return
Average Daily Profit/loss
Ave Daily Compounded Return
Number of Closed Trade Drawdowns
Average Drawdown
Average Drawdown (%)
Average Length of Drawdowns
Average Trades in Drawdowns
Worst-case Drawdown
Date at Trough
Trade Number at Trough
Length of Drawdown
Trades in Drawdown
Worst-case Drawdown (%)
Date at Trough
Trade Number at Trough
Length of Drawdown
Trades in Drawdown
Longest Drawdown
Start of Drawdown
End of Drawdown
Percent of Equity of longest drawdown
If desired, the performance statistics can be exported to a text file via the context (right-click) menu. A description of each statistic is provided in the appendix to the help files, which can be accessed by pressing the F1 key.
A subset of these statistics is computed during the Monte Carlo analysis. See Monte Carlo Analysis.
To learn more about Market System Analyzer (MSA), click here.
To learn how Market System Analyzer makes it easy to perform Monte Carlo analysis, click here.