Dow
vs. E-mini S&P
A number of traders have
expressed to me their interest in the Dow futures traded at the Chicago Board of
Trade (CBOT). While the E-mini's have at least 10 times the volume of the Dow
futures, the familiarity of the DJIA index probably draws some traders to the
Dow futures. I decided to examine the correlation between the Dow and the
S&P 500 futures and see if it might be worthwhile to trade MiniMax II on the
Dow futures.
The first thing I looked at was the
correlation between the prices. Take a look at Fig. 1, which shows the percent
change in the weekly closing price of the Dow futures (DJ), the E-mini S&P
futures (ES), and the E-mini Nasdaq 100 futures (NQ).
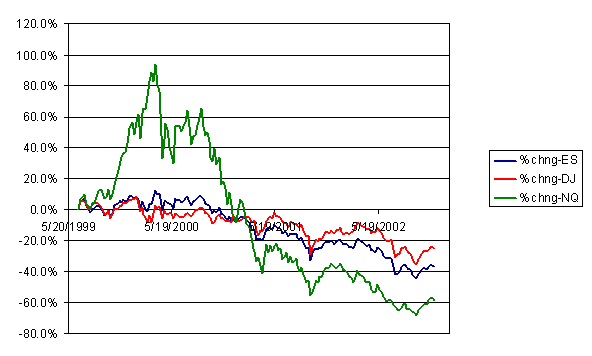
Fig. 1. Percent change
in weekly closing price of the E-mini S&P 500, Dow, and E-mini
Nasdaq 100 futures.
I used TradeStation 6 as my data
source and examined weekly closing prices as given by continuous contract data.
The symbols in TS 6 were @ES, @NQ, and @DJ.C. All three data series include the
evening session prices. I saved the data to a text file using the data window,
then opened the files in Excel to create the plot shown above. Obviously, the ES
and DJ are much more similar to each other than either one is to the
NQ.
Using the correlation function
("Correl") in Excel, I calculated the correlations between the markets. By
definition, a correlation of 1.0 is a perfect positive correlation, and a value
of -1.0 is a perfect negative correlation. The correlations I obtained are shown
below:
| ES-DJ |
0.945931 |
| ES-NQ: |
0.933674 |
| DJ-NQ: |
0.796283 |
As expected, the highest correlation
is between the ES and the DJ. However, the interesting result is that the Nasdaq
has a much lower correlation with the Dow than with the S&P. This suggests
it might be possible to obtain better diversification trading the NQ with the DJ
than with the ES. To find out if this is true, I next looked at the correlation
between the equity curves produced by MiniMax II on each market.
Before I could generate an equity
curve for trading MiniMax II on the Dow, I had to find a good set of parameter
values for the Dow. After a little optimization, I came up with the following
set of parameter values, which I include here for the benefit of those who trade
MiniMax II: 0.3, 0.8, 0.3, 0.4, 2.5, 0.8, 1.6. The optimization encompassed 173
trades over bull, bear, and trading range markets and produced a very smooth
equity curve.
The equity curves produced by
MiniMax II on each of the three markets is shown below in Fig. 2. For the ES and
NQ, I used the recommended parameter values. The curves are for trading one
contract and were produced using the built-in Strategy Equity indicator of
TradeStation.
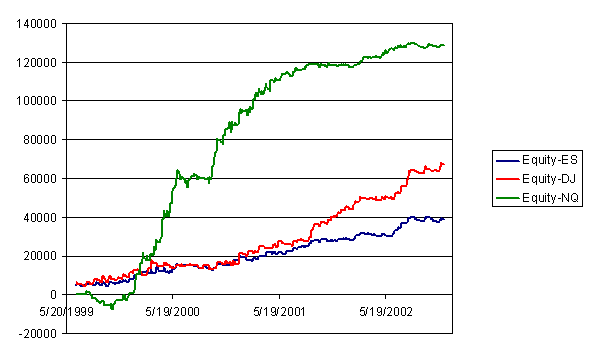
Fig. 2. One contract
equity curves for MiniMax II on the E-mini S&P 500, Dow, and E-mini Nasdaq
100 futures.
As with the weekly price data
(Fig. 1), the equity curves for the ES and DJ are fairly similar and are much
different than that of the NQ. The correlations between the equity curves are as
follows:
|
ES-DJ: |
0.975453 |
| ES-NQ: |
0.915535 |
| DJ-NQ: |
0.827657 |
The results here mirror those
of the prices. The equity curves from the ES and DJ are tightly correlated, as
expected. However, the equity curve from the NQ is less correlated with the
equity curve from the DJ than with that of the ES. This supports
the notion that trading the NQ with the DJ may provide better diversification
than trading the NQ with the ES.
The last step was to see if combining the equity curves with a fixed
fractional approach, as I currently recommend for trading MiniMax on
the NQ and ES, would produce better results with the NQ and DJ together than for
the NQ and ES together. The baseline result is shown below in Fig. 3, which
depicts the combined equity curve for trading MiniMax II on the ES and NQ using
the recommended parameter values and fixed fractions. The fixed fractions in
this case are 3% and 4% for the ES and NQ, respectively. The maximum
peak-to-valley drawdown over the test period is 26.6%.
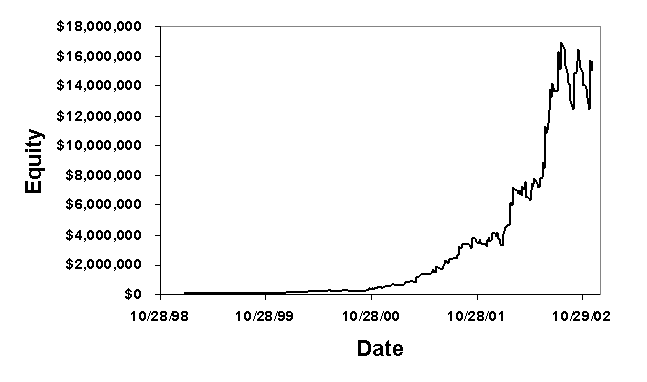
Fig. 3. Fixed
fractional equity curve for MiniMax II on the E-mini S&P 500 and E-mini
Nasdaq 100 futures.
The combined equity curve for the
NQ and DJ is shown in Fig. 4. I found that fixed fractions of 4% for each market
produced the same maximum drawdown (26%) as for the NQ-ES portfolio.
However, notice how much higher the ending equity value is.
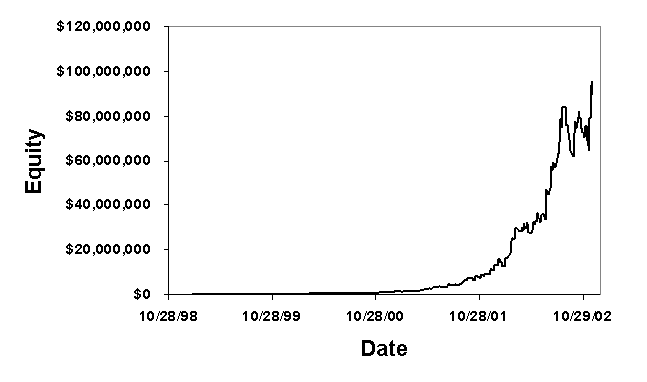
Fig. 4. Fixed
fractional equity curve for MiniMax II on the Dow and E-mini Nasdaq 100
futures.
The lower correlation of
the equity curves allows for a larger fixed fraction and provides a much greater
rate of return than trading the NQ with the ES.
Lastly, I combined all
three equity curves using fixed fractions of 2%, 3.5%, and 3% for the ES, DJ,
and NQ, respectively. As above, these fixed fractions were chosen to obtain a
maximum drawdown of about 26% to match that of the ES-NQ equity curve. This
three-market portfolio is shown below in Fig. 5.
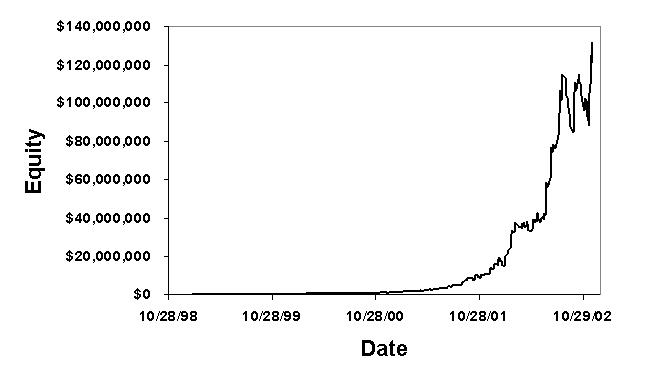
Fig. 5. Fixed
fractional equity curve for MiniMax II on the E-mini S&P, Dow, and E-mini
Nasdaq 100 futures.
With the same drawdown as for the
ES-NQ and DJ-NQ combinations, a much higher final equity value is achieved by
trading all three markets. Also note that if you add up the fixed fractions, the
total is 8.5%. In other words, you would lose at most 8.5% of your account
equity at one time if you had a loss in each market at the same time. This
compares to a total risk of 8% for the DJ-NQ combination. This means that by
adding a third market to the mix, our total position risk increases by only
0.5%.
Before you send me an email asking
if you should start trading the Dow or replace the ES with the DJ, let me add a
few cautionary points. First, as mentioned above, the Dow futures have nowhere
near the liquidity of the E-mini's. Whether this would be a problem for you or
not I can't say. I've never traded the Dow futures, and I can't comment on the
type of fills you should expect. Secondly, the equity curve I'm showing for the
DJ is based on an optimization that includes the period shown in the figures.
While I believe the parameter values are valid, there may be a bias in the
results for the Dow relative to the results for the
E-minis.
The bottom line is that if you trade
the Nasdaq and/or S&P futures now, it may be worthwhile to take a look at
the Dow. As far as MiniMax is concerned, there appears to be some value in
adding the Dow futures to the MiniMax mix. I may consider adding the Dow to my
own trading. However, since the fixed fractions are somewhat lower for the
three-market portfolio, I will need to determine if I have enough equity to make
it work. Also, I wouldn't recommend blindly jumping into a new market if you've
never traded it before. I frequently find that it pays to be cautious in futures
trading.
Your
Question
Q:
I got a lot
of slippage on a recent exit in the NQ when the market briefly plunged then
rebounded past my stop price. Should I be using stop-limit orders instead of
stop orders?
A: Good question.
When the price of your stop order is reached, the stop order becomes a market
order and is filled at the best available price. In a fast moving or thinly
traded market, it's possible to get a lot of slippage. Fortunately, the E-mini's
are usually very liquid (i.e., heavily traded) during the day session, so most
stop orders (at least for relatively small sizes) are filled exactly at the stop
price (i.e., without slippage). However, there are occasions where bad slippage
occurs. Your recent bad experience was on the Friday after Thanksgiving when the
volume was much lighter than usual. Some trader probably put in a big sell
order, which under normal circumstances would have been easily absorbed. In a
thinly traded market, buyers were scarce, so the market fell sharply before
anyone stepped in to bid it back up.
A stop limit order would have solved
your problem in this case. With a stop limit order, you not only specify the
stop price but the worst price at which you'll accept the fill. For example, you
might specify "sell 2 Dec NQ 105000 stop with 104800 limit." If the market drops
to 105000, you'll get filled at no worse than 104800. I've been told that stop
limit orders have precedent over stop orders, at least in the e-mini's. In other
words, if another trader has a stop order at 105000 and you have a stop limit at
105000, your order will get filled first, assuming it can get filled within your
limit price.
The drawback of a stop limit order
is that it doesn't guarantee that you'll get filled. If the market gaps past
your limit price, your order won't get filled, and you could be exposed to a
large loss. In the example provided in the question, the market rebounded after
spiking lower, but this may not always happen, of course. You do take a risk
with a stop limit order. Unfortunately, the risk is often greatest when you need
the protection of a stop limit order the most; namely, in thin
markets.
I would recommend placing stop limit
orders in the evening session for the E-mini's and maybe during pre- and
post-holiday sessions where the volume is expected to be low. Your goal when
placing a stop limit order should be to avoid getting a bad fill on a spurious
market move. Getting a bad fill on a genuine market move -- even when the move
is sudden and large -- is an unavoidable part of trading.