|
||
|
||
|
|
|
|
Constraint-Driven Strategy Design by Michael R. Bryant
When I was a graduate student in engineering studying mechanical design more than two decades ago, one of the most interesting research projects I encountered used a computer algorithm to determine the optimal shape for a structural component -- basically, a machine part -- based only on the forces and loads the part was required to handle. The traditional approach would have been to start with some initial shape, then use an iterative process of repeated analysis and redesign to gradually hone in on the optimal shape, with the engineer specifying each change in geometry, subject to subsequent analysis.
What made the research project so interesting to me was that the computer algorithm was not only automating the analysis steps but was specifying the change in geometry at each step, essentially automating what would traditionally have been a labor-intensive task. This was an example of constraint-driven design. The constraints in this case were the forces and loads the object was required to withstand.
As a somewhat more relatable example, consider a hypothetical computer program that could design an automobile based only on "constraints" like the required gas mileage, acceleration, range, number of passengers, number of doors, and so on. While today's technology is probably not quite up to such a task, the same basic approach can be used quite effectively for designing trading strategies.
Strategy Design Constraints The term constraint is borrowed from the field of mathematical optimization, in which optimization problems can be categorized as either constrained or unconstrained. The latter consist of problems in which an objective function is either minimized or maximized. Constrained problems, on the other hand, add to that a series of conditions, which are expressed as either equality or inequality equations. These are the constraints. The solution to a constrained optimization problem not only has to minimize or maximize the objective function, it has to satisfy the constraint equations.
So what do constraints look like in
the context of trading strategy design? One approach is to think about what a
good trading strategy looks like. Do you like to see a profit factor greater
than 2.0? Do good trading strategies have at least 60% winning trades in your
opinion? Do you need to see no more than four consecutive losing trades to
consider it a good strategy? If you can quantify what you consider a good
trading strategy to be in terms of metrics of performance, then you can use
those as constraints.
In addition to the more common general purpose metrics, such as the profit factor and Sharpe ratio, there are a number of less common metrics that can be helpful in designing just about any strategy. For example, the correlation coefficient of the equity curve is a measure of how closely the equity curve approximates a straight line. The closer the coefficient is to 1.0, the closer the equity curve is to a straight line, which implies more consistent and uniform performance. Setting a constraint on the correlation coefficient to be greater than or equal to 0.95 can be useful for building any type of strategy.
The statistical significance of the average profit/loss is another metric that can be used as a constraint for any strategy. This measures how likely it is that the average trade is greater than zero, given the variability in the trade results and based on the so-called sampling distribution of the average trade. Because the significance takes into account both the number of trades and the standard deviation of the trades and is expressed as a percentage, it's a good alternative to the number of trades as a build constraint. In other words, rather than trying to figure out how many trades you need in the back-test period to ensure meaningful results, you can specify a significance value greater than, say, 95%.
A somewhat more unusual metric that can be useful as a general purpose build constraint is the Kelly fraction. This is a theoretical measure of the optimal fraction of account equity to risk on each trade. Higher values imply that more equity can be risked on each trade. Consequently, the Kelly fraction can be viewed as a measure of how quickly the strategy returns can be compounded. Alternatively, you can think of it as an overall measure of strategy quality since the ability to compound results faster implies a higher quality strategy. One trader who contacted me about his use of the Kelly fraction as a build metric likes to see values above 20%.
Building from Constraints The constraints set the boundaries for the strategy design. The other elements of the design process include the objective function to maximize or minimize and the algorithm used to find the strategy that maximizes or minimizes the objective function while satisfying the constraints. As alluded to above, these elements define a constrained optimization problem.
In constraint-driven design, the hard work is typically done by the constraints, which is where most of the effort should be focused. The objective function, on the other hand, can be relatively simple, such as maximizing the net profit. However, as shown in the examples below, it's sometimes better to add a few of the general-purpose metrics that appear in the constraint conditions. For example, a suitable objective could be maximizing the sum of the net profit, correlation coefficient, and significance. In this case, each term would be scaled to the range 0 - 1 to give them equal weight in the objective function.
Given the objective function and the constraint conditions, the strategy design is found as the solution to the corresponding optimization problem. All optimization algorithms are essentially search algorithms, which start with a non-optimal (in some cases, random) design and modify it over a series of steps, eventually converging to the solution.
In the examples presented below, the optimization problem is solved using a genetic programming algorithm, which is suited to generating programming code, including trading strategies. The details of how this works are described elsewhere; see, for example, Building Trading Systems Using Automatic Code Generation. In short, a population of trading strategies is evolved over multiple generations by recombining and modifying members of the population in analogy to the biological processes of reproduction and evolution. The software Adaptrade Builder, which implements the genetic programming algorithm, was used to build the strategies. The user's guide for Adaptrade Builder includes additional details of the algorithm.
An Example of Constraint-Driven Design To illustrate the constraint-driven strategy design process, trading strategies were built for daily bars of Apple stock (symbol AAPL). Apple has been in a nearly steady up-trend for years, which might make it seem like an easy choice. However, as will be shown below, the challenge is to adequately handle the high volatility of the stock.
In the examples that follow, strategies were built over the period 9/19/1994 to 6/16/2009, with the period from 6/17/2009 to 2/21/2013 used for out-of-sample testing. Costs of $0.05 per share were assumed, and a starting account equity value of $25,000 was used. The number of shares for each trade was determined using "percent of equity" position sizing. This means the value of each trade was a specified percentage of account equity. In the first build, 100% of equity was used, which means the account equity was fully invested on each trade. In a second build, the percent of equity was chosen by the build algorithm. In both cases, all profits were re-invested.
The following list of build constraints were used:
In addition to the build constraints, the build objectives were set as follows:
The complexity metric measures the number of strategy inputs. It was included in the build objectives with a relatively small weight to help bias the strategies to ones with fewer inputs and therefore less complexity.
The build objectives together with the build constraints define the so-called fitness function for the genetic programming process. The fitness function is equivalent to the objective function for the corresponding optimization problem. The build process tries to maximize the fitness. The build objectives combine in a scaled fashion so that the maximum possible fitness value among members of the population is 1.0. This would occur for the fittest member of the population when all the constraint conditions are satisfied. Any constraint condition that is not satisfied subtracts from the fitness, such that each constraint can subtract a maximum value of 1.0 from the fitness. This means that if one or more constraints are not met, the fitness can be a negative number. Conversely, a negative fitness value implies one or more unsatisfied constraints.
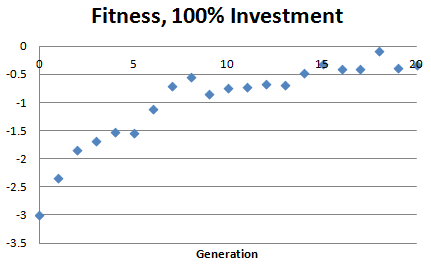
Full Investment A population of 500 strategies was evolved over 20 generations in Adaptrade Builder. Fig. 1 shows how the average population fitness increased from generation to generation when the account equity was fully invested on each trade. Notice that while fitness generally increased as the build progressed, the fitness never became positive, which implies that one or more of the constraints was not met.
Figure 1. Average population fitness versus generation number for AAPL strategies in which 100% of equity was invested in each trade.
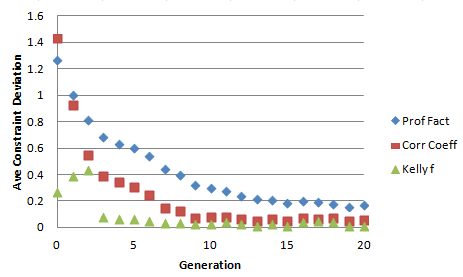
Three of the constraints are shown below in Fig. 2, which depicts the average deviation of each metric from the constraint value across members of the population. For example, the average deviation of the profit factor starts out at about 1.2. Since the constraint condition for the profit factor specified a value greater than or equal to 2, this means the average profit factor among strategies in the initial population was about 0.8.
Figure 2. Average constraint deviation versus generation number for AAPL strategies in which 100% of equity was invested in each trade. Constraint deviations for profit factor, correlation coefficient, and Kelly fraction are shown converging to near zero.
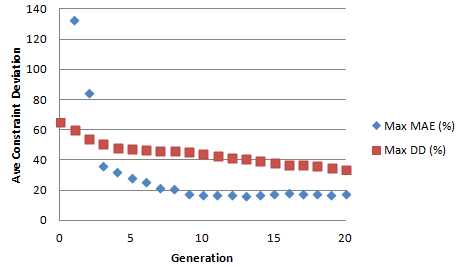
Ideally, the constraint deviations should converge to zero as the build process progresses. For the most part, this is what Fig. 2 indicates. However, consider the same type of plot for the maximum MAE and maximum percentage drawdown, as shown in Fig. 3.
Figure 3. Average constraint deviation versus generation number for AAPL strategies in which 100% of equity was invested in each trade. Constraint deviations for maximum MAE and maximum percentage drawdown are shown converging to high values, indicating the constraints have not been met.
The constraint for the maximum MAE specified a value no larger than 10%. As shown in Fig. 3, even after 20 generations, the average population value of the maximum MAE was still about 17 percentage point above that or about 27%. Likewise, the constraint for the maximum percentage drawdown was 30%, yet after 20 generations, the population average was about 63%. This explains why the fitness remained negative even after 20 generations: the optimization was unable to satisfy these two constraints.
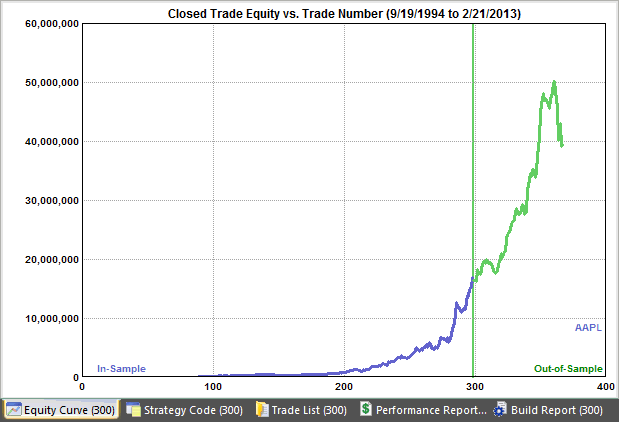
Why did this happen? Fig. 4 shows the equity curve for one of the top strategies resulting from the build process. Over the entire nearly 18 year period, a net profit of more than $39 million was seen, starting with just $25,000. The average annual return was more than 50%. However, the "catch" to these eye-popping returns is in the two constraints that the build process couldn't satisfy. The maximum peak-to-valley percentage drawdown over this period was just over 50%, and the worst-case MAE (maximum adverse excursion), which measures the open trade drawdown, was 20%. That means that in order to realize these returns, you would have had to tolerate as much as a 20% drawdown on a single trade and a total drawdown of more than 50% of equity.
Figure 4. Equity curve for a top AAPL strategy in which 100% of equity was invested in each trade.
The reason the build process converged to this type of strategy, rather than one that met all the constraints, is that the chosen position sizing forced each strategy to be fully invested on each trade. That guaranteed that the underlying volatility of the stock price would be reflected in the results.
Optimal Investment To see that this is indeed what happened, a second build was run in which the value of the percent-of-equity position sizing was allowed to be chosen by the build algorithm. Rather than investing 100% of equity on each trade, the algorithm was free to trade fewer shares if it helped meet the constraints.
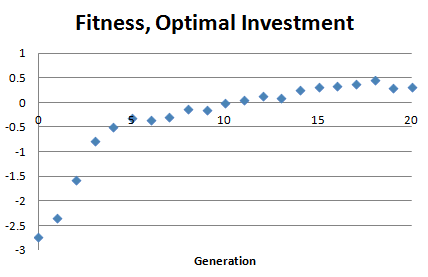
Figure 5. Average population fitness versus generation number for AAPL strategies in which less than 100% of equity was invested in each trade. Compare to Fig. 1.
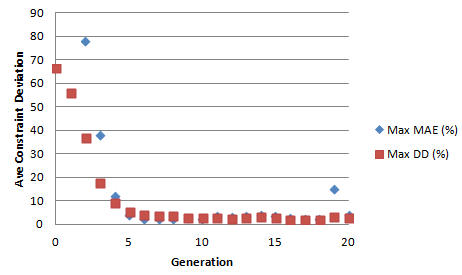
Fig. 5 shows how the fitness evolved during the build process. Notice that the average population fitness became positive after about 10 generations, unlike in Fig. 1, where the fitness was negative even after 20 generations. The evolution of the maximum MAE and drawdown constraints is shown below in Fig. 6. Unlike in Fig. 3, which shows the same results for the case of full investment, the results in Fig. 6 show that the deviations of the maximum MAE and maximum drawdown converge to zero, indicating that the constraints have been met.
Figure 6. Average constraint deviation versus generation number for AAPL strategies in which less than 100% of equity was invested in each trade. Constraint deviations for maximum MAE and maximum percentage drawdown are shown converging to near zero, indicating the constraints have been satisfied. Compare to Fig. 3.
As noted above, the difference in this second build was that the percentage of equity for position sizing was allowed to be chosen by the build algorithm, rather than being fixed at 100%. For one of the top strategies in the population, the percent of equity that resulted from the build process was 24%. This means that 24% of the account equity was invested in each trade, rather than 100% as in the prior build.
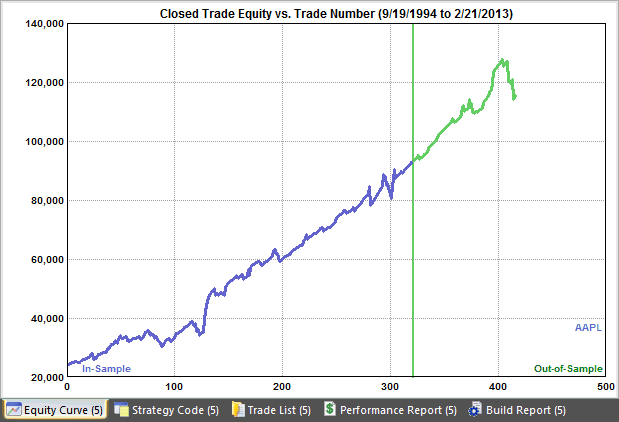
The resulting equity curve for this strategy is shown below in Fig. 7. In stark contrast to the out-sized returns shown in Fig. 4, the results shown here correspond to a net profit of about $90,000 and average annual returns of just under 9%. However, unlike the strategy shown in Fig. 4, this strategy meets all the specified constraints, including a maximum MAE of about 9% and a worst-case drawdown of about 19%.
Figure 7. Equity curve for a AAPL strategy in which 24% of equity was invested in each trade.
Conclusions This article described the general process of designing trading strategies from a set of constraint conditions formed in terms of performance metrics. It was shown that the constraint-driven design process is equivalent to a constrained optimization problem, and an example was presented to show how the optimization problem can be solved using a genetic programming algorithm.
The example used Apple stock (AAPL) to show how the build process tends to satisfy the constraint conditions as it converges to a solution. The example also illustrated that the constraints have to be achievable in light of the market and the restrictions imposed on the strategy. In the first build case, two of the constraints could not be met by the build algorithm because the settings forced the strategies to be fully invested on each trade, and the stock price was highly volatile, resulting in larger MAE and drawdown values than specified in the constraints. While the resulting strategy far out-performed buy-and-hold, it failed to meet all the constraints.
In the second build case, the requirement to be fully invested was lifted, and the build algorithm was allowed to choose the percentage of invested equity. This allowed the MAE and drawdown constraints to be satisfied by investing only a fraction of the account equity on each trade. However, in doing so, the resulting performance was well below that of buy-and-hold. Because the MAE and drawdown constraints were chosen based on trader-oriented requirements -- the desire for reasonable risk -- rather than market-based values, the build process was forced to build strategies that under-performed the market in order to satisfy the constraints.
Provided the build constraints are realistic and are aligned with the characteristics of the market or markets, a constraint-driven strategy design approach can be very effective in coming up with strategies that meet your needs.
Mike Bryant Adaptrade Software * For licensing reasons, project files do not include price data. Project files were built with Builder version 1.5.2. ** All strategies associated with this article are for educational purposes only and are not intended for live trading.
This article appeared in the February 2013 issue of the Adaptrade Software newsletter.
HYPOTHETICAL OR SIMULATED PERFORMANCE RESULTS HAVE CERTAIN INHERENT LIMITATIONS. UNLIKE AN ACTUAL PERFORMANCE RECORD, SIMULATED RESULTS DO NOT REPRESENT ACTUAL TRADING. ALSO, SINCE THE TRADES HAVE NOT ACTUALLY BEEN EXECUTED, THE RESULTS MAY HAVE UNDER- OR OVER-COMPENSATED FOR THE IMPACT, IF ANY, OF CERTAIN MARKET FACTORS, SUCH AS LACK OF LIQUIDITY. SIMULATED TRADING PROGRAMS IN GENERAL ARE ALSO SUBJECT TO THE FACT THAT THEY ARE DESIGNED WITH THE BENEFIT OF HINDSIGHT. NO REPRESENTATION IS BEING MADE THAT ANY ACCOUNT WILL OR IS LIKELY TO ACHIEVE PROFITS OR LOSSES SIMILAR TO THOSE SHOWN. |
If you'd like to be informed of new developments, news, and special offers from Adaptrade Software, please join our email list. Thank you.
For Email Marketing you can trust
|
|||||||||||||||
|
|
|
|
|||||||||||||||
Copyright (c) 2004-2019 Adaptrade Software. All rights reserved.