|
||
|
||
|
|
|
|
Adaptive-Look-Back Indicators by Michael R. Bryant
Technical indicators are one of the fundamental elements of systematic trading. Indicators, such as moving averages or stochastics, can be viewed as transformations of the input series (typically, price or volume) designed to accentuate a particular aspect of the market, such as its trend or cyclicality. While fundamental to most systematic trading methods, many traders avoid the most common indicators, such as simple moving averages and the relative strength indicator (RSI), in the belief that the market has adapted to their use, reducing their effectiveness.
One way to compensate for the effect of market efficiency on the viability of technical indicators is to modify them in some meaningful way. For example, Chande and Kroll's VIDYA indicator1 is an exponential moving average in which the smoothing factor is dependent on market volatility, so that the effective look-back length is reduced when volatility increases. In this article, I'll develop an extension of the adaptive look-back approach and show how to apply it to a variety of indicators with only a few extra lines of code. The resulting indicators provide greater versatility than prior indicators and may be more consistent with a statistical view of the markets.
Adapting the Look-Back Length Given that the markets are constantly changing, it makes sense to try to adapt to the changes as much as possible. Most technical indicators were originally developed with a fixed look-back length; for example, the number of bars in a simple moving average. A number of authors have proposed adapting the look-back length to market volatility.
For the Variable Index Dynamic Average (VIDYA) indicator, for example, Chande and Kroll used several different metrics, including a volatility index based on a normalized standard deviation of price in which higher values of the index resulted in a lower effective look-back length. The idea was that during periods of higher volatility, the moving average should be more responsive to the market whereas during periods of lower volatility, a longer-period moving average was more consistent with the market's behavior.
Kaufman took a somewhat different approach.2 The idea behind his Kaufman Adaptive Moving Average (KAMA) was that during periods of high volatility, you're more likely to get whip-sawed as the market swings back and forth, resulting in repeated losses. To avoid that, he used a longer period for the moving average during periods of choppy price action so that the average would be less responsive to the market volatility, resulting in fewer reversals. During trending market action, the period of the moving average was decreased so that trades could react more quickly to the change in direction.
To measure "choppiness", Kaufman used the so-called efficiency ratio (ER), which measures the absolute value of the change in price over the look-back period divided by the sum of the absolute values of the bar-to-bar price changes over the same period. If, for example, the net change in price is zero -- the price is the same at the end of the period as at the start -- then the ER will be zero. In this case, the market is perfectly inefficient in that it may move around a lot from bar to bar, but it doesn't go anywhere. If, on the other hand, the market moves steadily in one direction (either up or down), so that each bar's move contributes to the net change in price, the ER will be 1. In this case, the market is perfectly efficient in that all of the bars' price moves contribute to the trend. In general, the ER will lie between 0 and 1.
A Different View of Adaptive Look-Back Lengths While many different metrics could -- and have been -- used to adapt look-back lengths, the efficiency ratio captures a fundamental aspect of market action; namely, the difference between trending and cyclic behavior. High values of ER imply a strongly trending market, which means very little cyclic movement, and low values of ER imply little trend and therefore more cyclic movement (except in the case of little movement at all).
This tends to support Kaufman's approach. However, his decision to use longer look-back lengths in choppy markets is based on (1) the assumption that we're adapting the look-back length of a moving average, and (2) the idea that the moving average is used to trigger a trade entry or exit.
An alternative viewpoint is the one espoused by John Ehlers through his work on applying signal processing methods to trading.3 His view is more along the lines of trying to more closely model the part of the market of interest (e.g., the trend component or the cycle component). From that point of view, a moving average in a choppy market should use a shorter look-back length to more accurately capture the higher frequency represented by the choppiness, whereas in a strongly trending market, a longer look-back length is more consistent with the market movement.
A third viewpoint is the one I'll adopt here; namely, a more statistical one. First, let's not assume anything more than absolutely necessary about the indicator in question and how it might be used. In particular, let's not assume the indicator in question is a moving average, and let's not assume it's applied to price. It might, for example, be the RSI of volatility or the moving average of the stochastic of volume. The indicator might be used in conjunction with other indicators as part of a larger rule for entry or exit, rather than by itself.
With this more statistically-oriented view, the goal is to create trading rules that have statistical validity, which means they fit the price action well without over-fitting. We're not assuming we know how the markets work well enough to make specific decisions about whether the look-back length should increase or decrease with something like the efficiency ratio. Rather, we have some reason to believe that the efficiency ratio may have relevance and we therefore want to include it as a variable, but we leave it to the market to tell us if and how it fits in. Statistical testing is used to tell us if the trading strategy that contains the indicator is statistically valid or if it's over-fit; i.e., invalid because it fits the noise rather than the signal of the market.
A More Versatile Adaptive Look-Back Given the preceding discussion, the adaptive look-back length developed here will be based on the efficiency ratio (ER) and will use a parameter to determine the relationship between ER and the look-back length. In particular, consider the following equation:
in which VER is the variable efficiency ratio, and TrendParam is the trend parameter, which can take any positive or negative value and which determines whether the look-back length will increase or decrease with increasing ER.
This is essentially just a way to reverse the ER ratio depending on the trend parameter. As shown below, rather than scaling the smoothing constant by ER, as Chande and Kroll and Kaufman essentially do, we use VER. With positive values of TrendParam, VER varies positively with ER, whereas with negative values of TrendParam, VER varies negatively with ER. With TrendParam equal to zero, VER is equal to 1 for all values of ER. The square is taken to better scale the values for use as a multiplier, as explained next.
To calculate the adaptive look-back length using this equation, we multiply the original value of the smoothing constant, Alpha, which corresponds to the original look-back length, by VER:
in which VAlpha is the adaptive smoothing constant, and Alpha is the original value of the smoothing constant.
The relationship between the smoothing constant and the look-back length is the same as for the exponential moving average; namely,
in which N is the look-back length, and Alpha is the smoothing constant. This equation can also be written for N in terms of Alpha as
The adaptive look-back length is therefore
in which N is the original look-back length.
To see how this works, consider the two figures below.
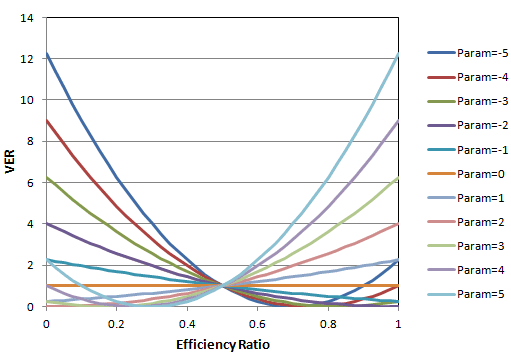
Figure 1. The relationship between the variable efficiency ratio and the efficiency ratio for different values of the trend parameter.
Figure 1 shows how the variable efficiency ratio varies as a function of the efficiency ratio for different values of the trend parameter ("Param"). Notice how the slope is generally positive for positive values of Param and generally negative for negative values of Param. With Param equal to zero, VER is equal to 1 for all values of the efficiency ratio. In this case, the value of Alpha does not change with the efficiency ratio. For example, for an exponential moving average, Param equal to zero corresponds to a regular exponential moving average.
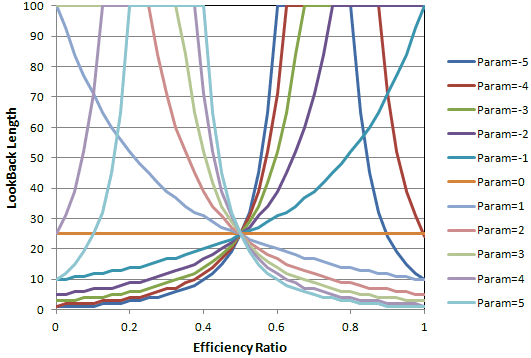
Figure 2 shows how the look-back length varies with the efficiency ratio for different values of the trend parameter ("Param"), assuming the original look-back length is 25. Notice that for a trend parameter value of zero, the look-back length is 25, independent of ER. For positive values of Param between 0 and 1, the look-back length decreases with increasing efficiency ratio. For negative values of Param between -1 and 0, the look-back length increases with increasing efficiency ratio.
Figure 2. The relationship between the look-back length and the efficiency ratio for different values of the trend parameter, assuming the original value of the look-back length is 25. A maximum value of 100 was imposed on the look-back length.
The look-back length was limited to a maximum value of 100 in Fig. 2. Notice that for more extreme values of Param (e.g., greater than 3 or less than -3), the curve reverses at the extremes of the efficiency ratio. This can have some interesting effects. For example, with Param equal to 4, the look-back length is equal to 25 with ER equal to zero (e.g., a flat market), rises to the maximum value of 100 for ER equal to about 0.125, then falls to a value of 1 at ER equal to 1 (e.g., perfect trend). The exact inverse behavior is achieved with a Param value of -4: the look-back rises from 1 to 100 and back down to 25 as the ER ranges from 0 to 1.
Applying it to Indicators In principle, the adaptive look-back length developed above can be applied to any indicator that uses a look-back length. This includes moving averages, momentum, MACD, rate-of-change, RSI, stochastics, and others. The simplest example is probably the exponential moving average. Consider the following EasyLanguage/TradeStation code for an adaptive exponential moving average called AdaptiveVMA:
The adaptive look-back length ("VN" in the equation developed previously) is provided by the function AdaptiveLen. This is then used to set the smoothing constant, Alpha, for the exponential moving average equation.
As another example, consider an adaptive inverse Fisher RSI function. This is the inverse Fisher transform of the RSI indicator in which the look-back length for the RSI has been replaced by the adaptive look-back length:
Because the look-back length changes from bar to bar, the RSI has to be calculated manually, rather than using the built-in RSI function provided by TradeStation. The only difference in the RSI calculation is that the Alpha value for the exponential smoothing of the AveChg and AveAbsChg variables is based on the adaptive look-back length. The inverse Fisher transform is taken to sharpen the turning points provided by the RSI.
Both of the functions provided above use "TrendParam" as an input so that the relationship between the efficiency ratio and the look-back length can be tailored to the needs of the market and to the application of the indicator.
Conclusions By adding an additional parameter -- the trend parameter -- to the calculation of the adaptive look-back length, it's not necessary to assume how the look-back length should vary with the efficiency ratio. Instead, optimizing the trend parameter in the context of the specific market and how the adaptive indicator is used in combination with other indicators will allow the market to tell us what the relationship should be. This makes the look-back length truly adaptive.
Of course, adding additional parameters to a trading strategy increases the complexity and therefore the risk of over-fitting. Modern statistical methods can and should be used to determine if a trading strategy has been over-fit. Lastly, real-time and forward testing always provide the ultimate validation of any trading strategy.
References
Mike Bryant Adaptrade Software
This article appeared in the April 2014 issue of the Adaptrade Software newsletter.
|
If you'd like to be informed of new developments, news, and special offers from Adaptrade Software, please join our email list. Thank you.
For Email Marketing you can trust
|
||||||||||||||
|
|
|
|
||||||||||||||
Copyright (c) 2004-2019 Adaptrade Software. All rights reserved.